Figure S2.
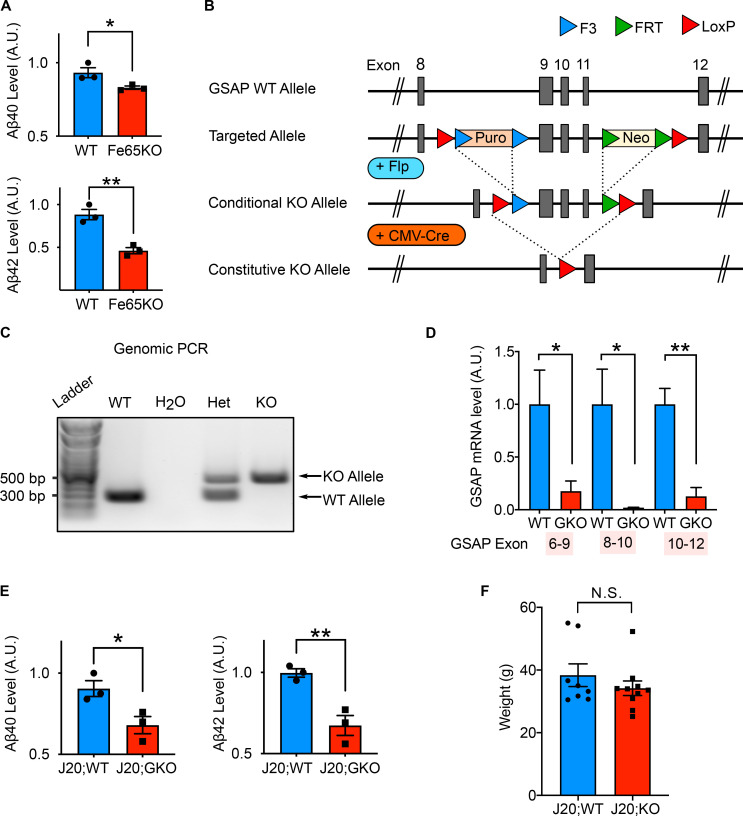
Validation of Fe65KO CAD cells and GSAP gene deletion in mice. (A) Quantification by ELISA of secreted Aβ40 and Aβ42 levels produced by WT and Fe65KO cells. Data represent mean ± SEM; unpaired t test; *, P < 0.05; **, P < 0.01. (B) Schematic of the gene-targeting strategy used to generate GKO mouse lines (Taconic Farms). Conditional GKO mice were crossed with CMV-Cre to generate constitutive KO mouse lines. (C) Genomic PCR analysis to distinguish WT (∼325 bp) and GKO (∼500 bp) alleles. Het, heterozygous of GSAP. (D) Quantitative PCR analysis in both WT and GKO mouse hippocampal tissues using primer sets across different GSAP exons. (E) Quantification by ELISA of soluble Aβ40 and Aβ42 levels in the hippocampi of J20;WT and J20;GKO mice. Data represent mean ± SEM; unpaired t test; *, P < 0.05; **, P < 0.01. (F) Weight was measured for mice used for behavioral studies at 6 mo of age. Data represent mean ± SEM; unpaired t test; N.S., not significant.

