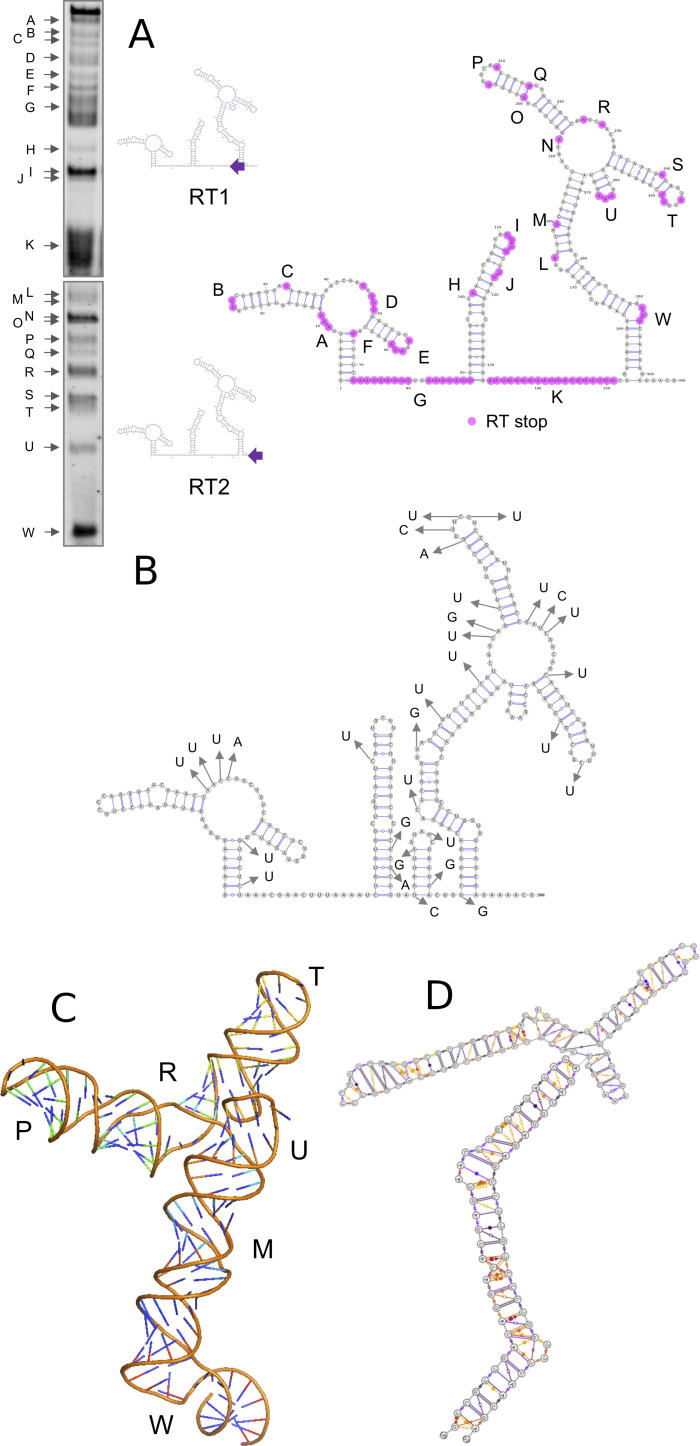
Figure 3.
The structure of the SARS‐CoV‐2 5′ UTR. A) RNA SHAPE gel results. Diagrams are included showing positions of the two IRD700 reverse transcription (RT) primers used; RT2 primer maps the whole sequence; however, longer molecules are not very well separated by electrophoresis, so RT1 was used to map the 5′ region in more detail. B) SARS‐CoV‐2 5′ UTR secondary structure showing the acylated nucleotides revealed by RT stops as purple dots. Open structures are labelled A–W. C) Positions of SNPs observed in SARS‐CoV‐2 viral sequences up until 7 Jan 2021. See also Figure S6 for overlay of Figure 3 B and 3 C. D) Snapshot of the dynamic three‐dimensional structure of the SL5 RNA from MD simulations. E) Leontis Westhoff diagrams highlighting the dynamic base‐pairing within the structure.

