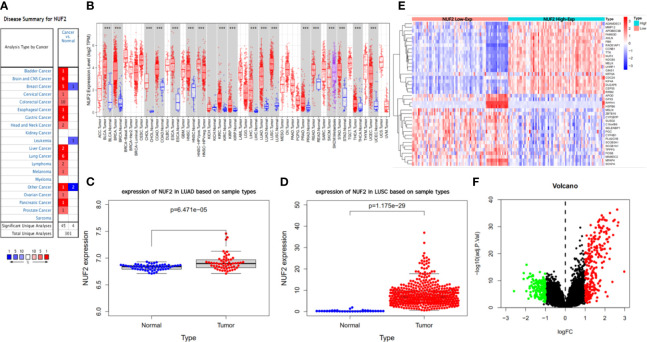
Figure 2.
Difference analysis of transcription levels for NUF2 in different type of tumor tissues and normal tissues. (A, B) The expression level of NUF2 in different type of tumor tissues and normal tissues via Oncomine and TIMER. (C, D) The NUF2 expression level of tumor tissues and normal tissues in NSCLC from TCGA data set and GEO data set (GSE32863). (E, F) Heatmap and volcano plot of mRNA expression changes based on NUF2 gene expression in NSCLC samples from GSE77803. ***p < 0.001.

