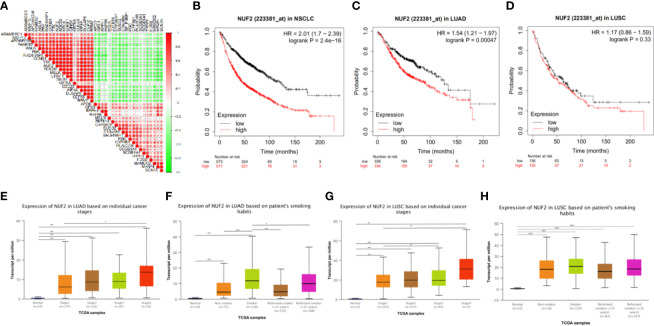
Figure 3.
(A) The correlation analysis of TOP20 differentially upregulated and downregulated expressed genes. (B–D) Kaplan-Meier survival curve comparing the OS time for different NUF2 expression subgroups in NSCLC and the subtypes (LUAD and LUSC) of NSCLC. (E–H) The association of NUF2 expression with clincopathological factors. Expression of NUF2 in NSCLC with different stages and smoking habits based on TCGA sample via UALCAN. *p < 0.05, **p < 0.01, ***p < 0.001.

