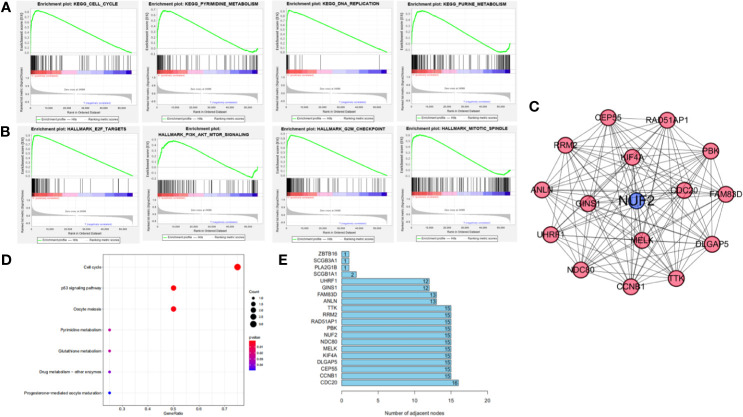
Figure 5.
(A, B) Gene set enrichment analysis of NUF2 in KEGG and Hallmark collections. (C) The significant module via MCODE in the Cytoscape which contain the nodes with most edges. (D) The most significant pathway in the module via pathway enrichment analysis. (E) The number of edges about each node in the network.

