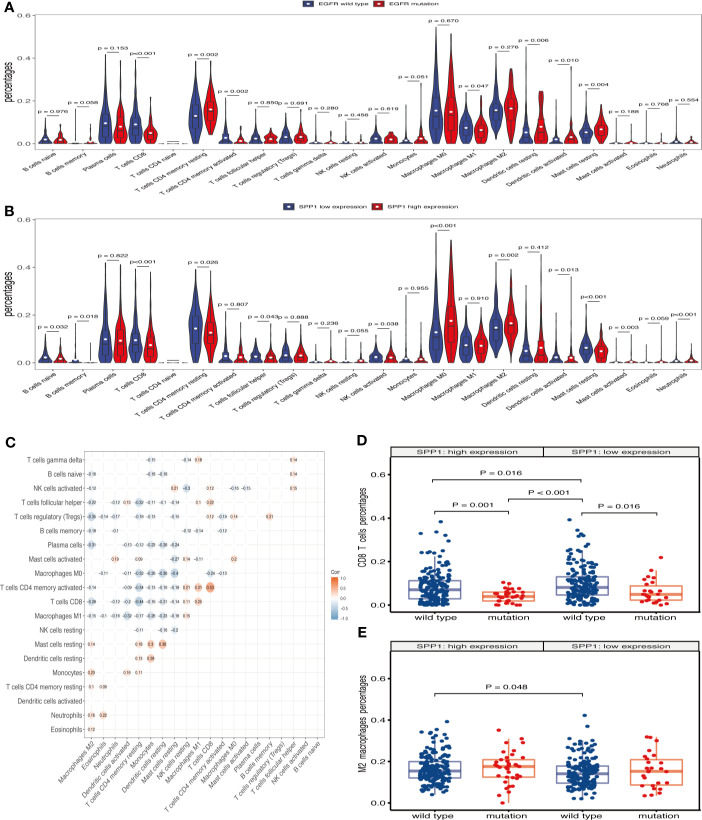
Figure 5.
SPP1-related immune infiltration alteration. (A) Violin plot showing the ratio differentiation of 22 kinds of TICs in EGFR wild-type and mutant samples. Wilcoxon rank sum was used for the significance test. (B) Violin plot showing the ratio differentiation of 22 kinds of TICs in low and high SPP1 expression groups. (C) The correlation between different TICs subpopulations. (D) Differences in CD8+ T cells infiltration between EGFR mutation and wild-type patients with SPP1 high- or low-expression group. (E) Differences in M2 macrophages infiltration between EGFR mutation and wild-type patients with SPP1 high- or low-expression group.

