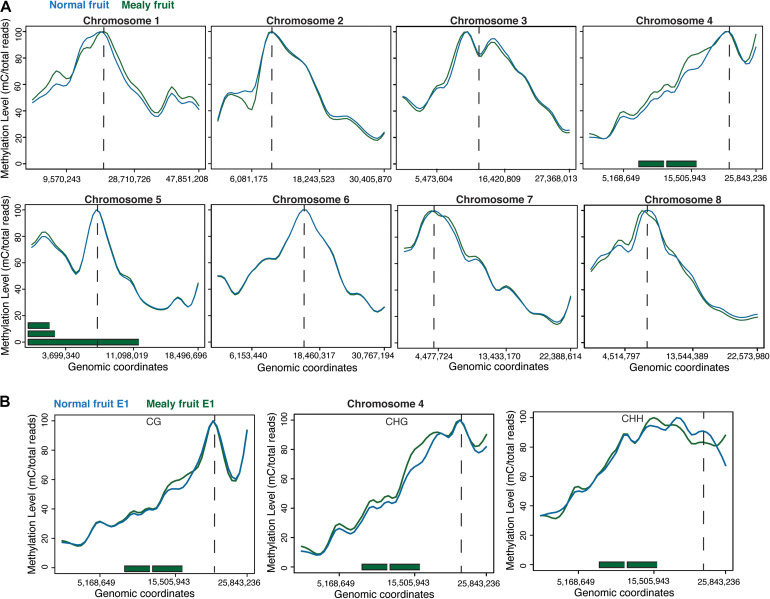
FIGURE 2.
DNA methylation levels across the eight pseudomolecules of P. Persica. (A) Methylation levels considering all cytosine contexts in normal fruits (blue line) and mealy fruits (green line). Horizontal green bars represent the location of previously identified QTLs for mealiness, while dashed vertical lines indicates the approximate location of centromeres. (B) Methylation levels in CpG, CHG, and CHH contexts within chromosome 4, the main candidate associated with mealiness phenotype based on QTL studies.

