FIGURE 3.
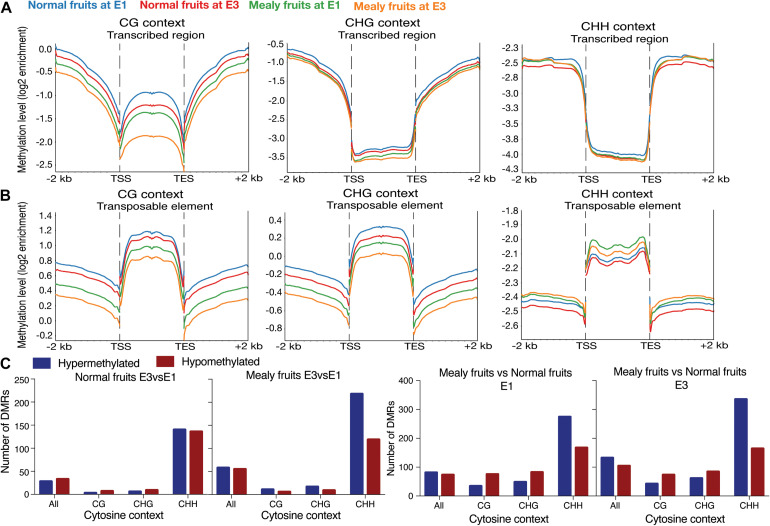
Average distribution of global DNA methylation throughout coding regions and number of differentially methylated regions. (A) DNA methylation level in annotated genes, including 2 kb upstream and downstream of the transcription start site (TSS) and transcription end site (TES), respectively. Each color represents a different condition. (B) DNA methylation level in annotated transposable elements (TE), including 2 kb upstream and downstream of TSS and TES. (C) Number of Differentially Methylated Regions (DMRs) close to annotated genes (up to 2 kb upstream and downstream) in normal fruits at E3 vs. E1 stages, mealy fruits at E3 vs. E1, mealy fruits vs. normal fruits at E1 and mealy fruits vs. normal fruits at E3. Blue bars indicate hypermethylated regions and red bars hypomethylated regions. DMRs where considered in all cytosine contexts and individual contexts (CpG, CHG, and CHH). Three biological replicates, a log2 enrichment difference >1 and a p-value < 0.05 were considered to identify a DMR.

