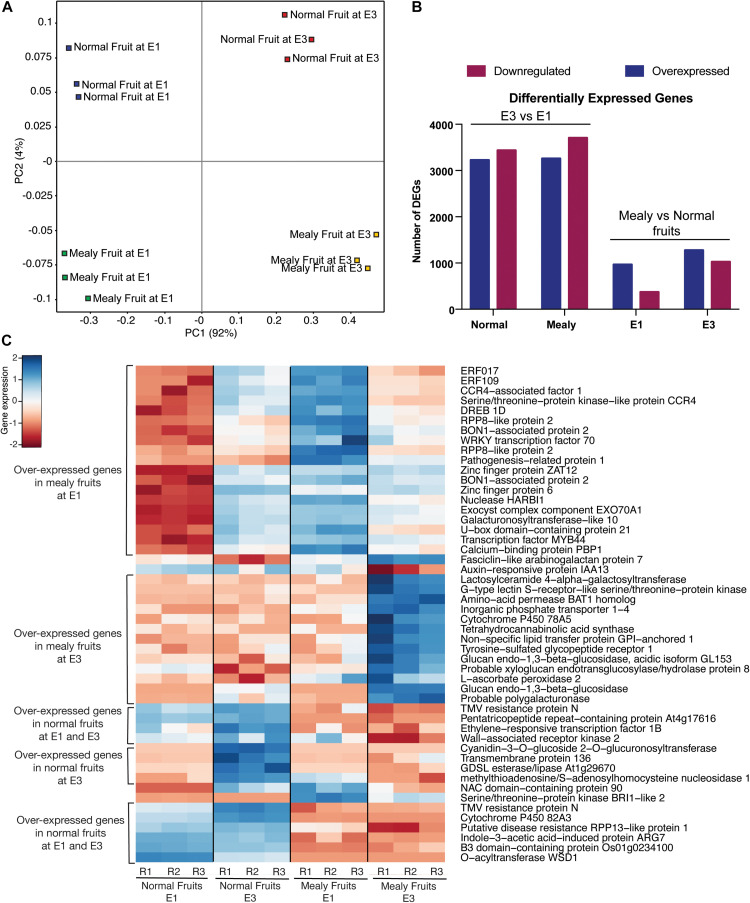
FIGURE 5.
Transcriptomic profile of P.persica fruits susceptible and resistant to mealiness. (A) Principal Component Analysis (PCA) of global gene expression in normal (resistant) and susceptible fruits at E1 and E3. (B) Number of differentially expressed genes (DEGs) at E3 vs. E1, and in mealy vs. normal fruits. (C) Heatmap of the top 50 DEGs with higher variance in their transcript level between normal fruits and mealy fruits. Color key indicates the median log2 TMM-normalized values, where red to blue represents low to high levels of transcript, respectively.

