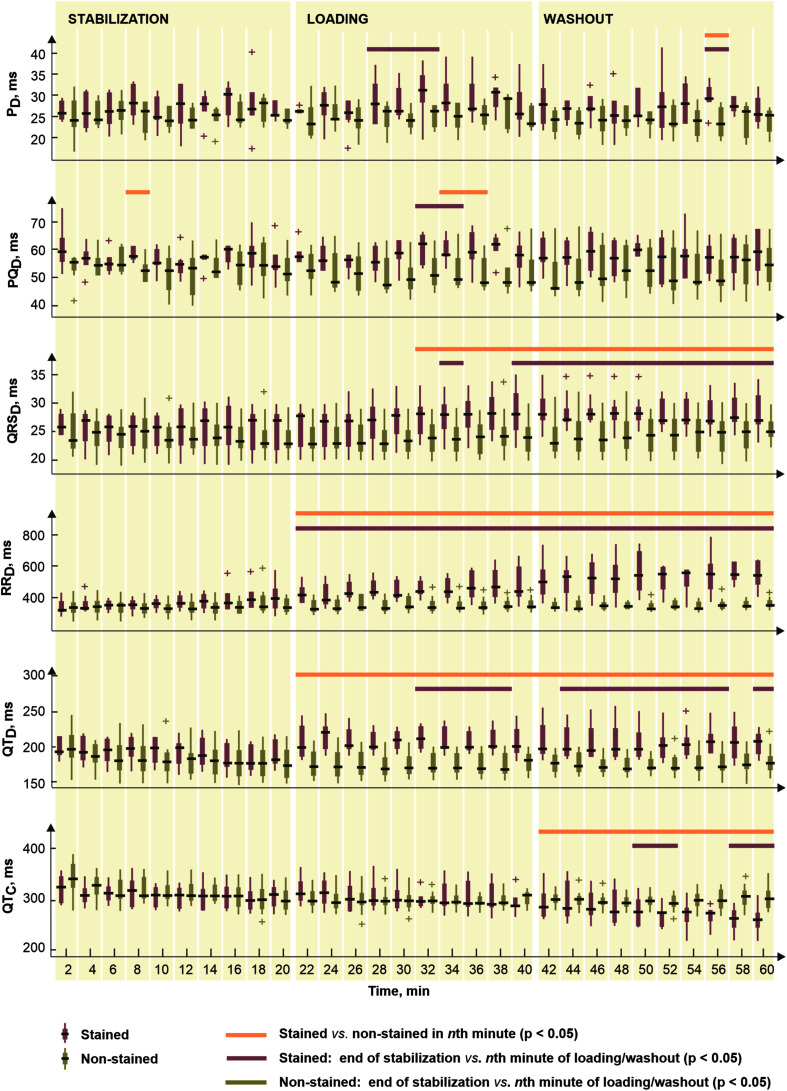
FIGURE 2.
Distributions of electrogram rhythm parameters in stained (n = 9) and non-stained (n = 11) hearts: PD, PQD, QRSD, RRD, QTD, and QTC, duration of P wave, PQ interval, QRS complex, RR and QT intervals, and corrected QT intervals, respectively. Displayed for every second minute of the period as median, the edges of the box indicate 25th–75th percentiles. Stabilization, dye loading and washout correspond with the notation used in experimental protocol with di-4-ANEPPS. Horizontal lines indicate significant differences (p < 0.05) revealed via paired and unpaired tests. “+” indicates outlier.

