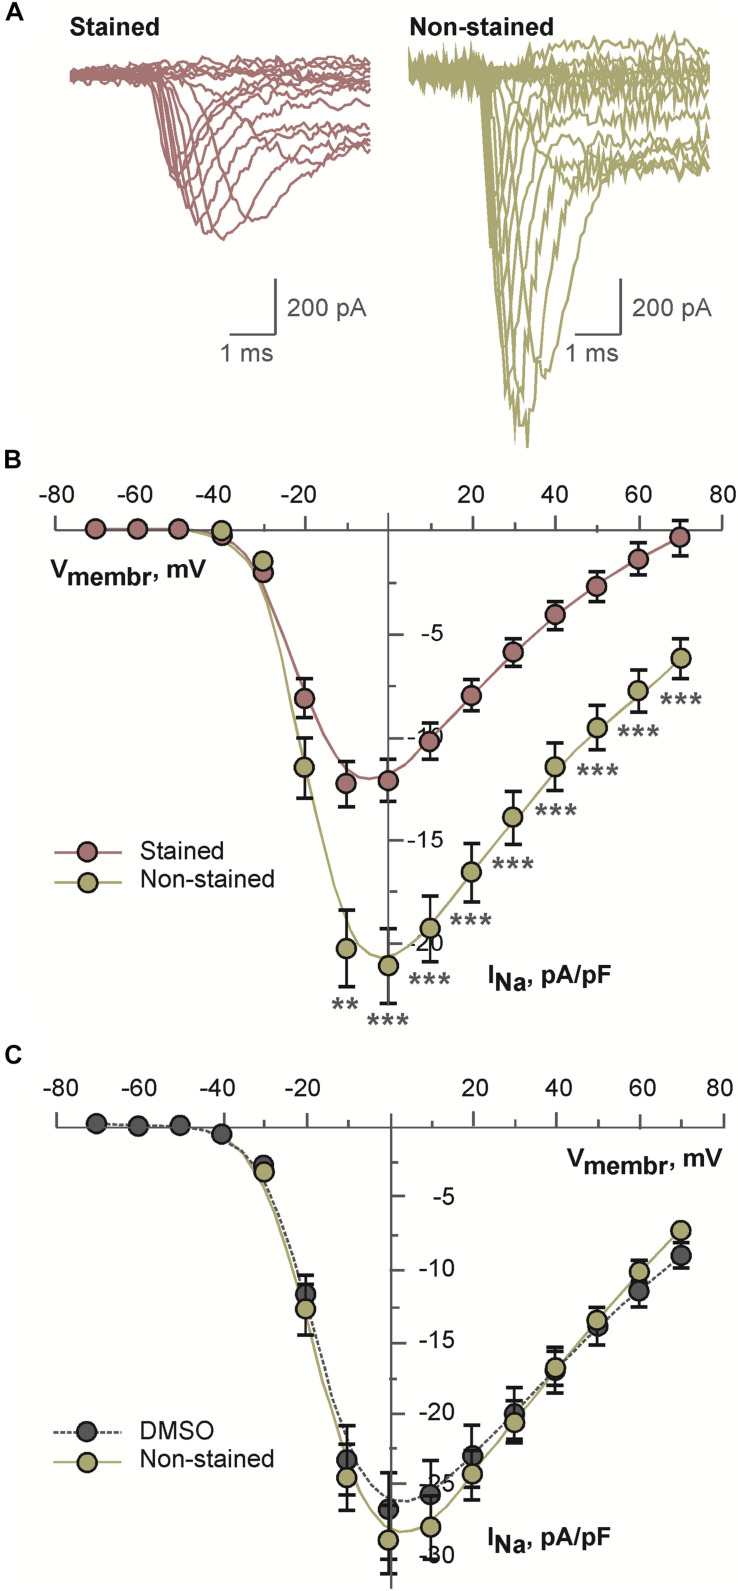
FIGURE 5.
Results of patch-clamp analysis of sodium channels in differentiated NG108-15 cells: (A) representative examples of current traces recorded after 30 min long incubation of cells in the presence of 2 μM di-4-ANEPPS (stained) or under the control conditions (non-stained); (B) averaged current-voltage relations for sodium current recorded after 30 min long incubation of cells in the presence of 2 μM di-4-ANEPPS (stained, n = 31) or under the control conditions (non-stained, n = 27); **p < 0.01; ***p < 0.001 (ANOVA and Tukey test); (C) averaged current-voltage relations for sodium current recorded after 30 min long incubation of cells in the presence of dye-free DMSO in the dilution 1:1,000 (DMSO, n = 19) or under the control conditions (non-stained, n = 16). In panels (B,C), solid lines represent B-spline fit to the experimental data.

