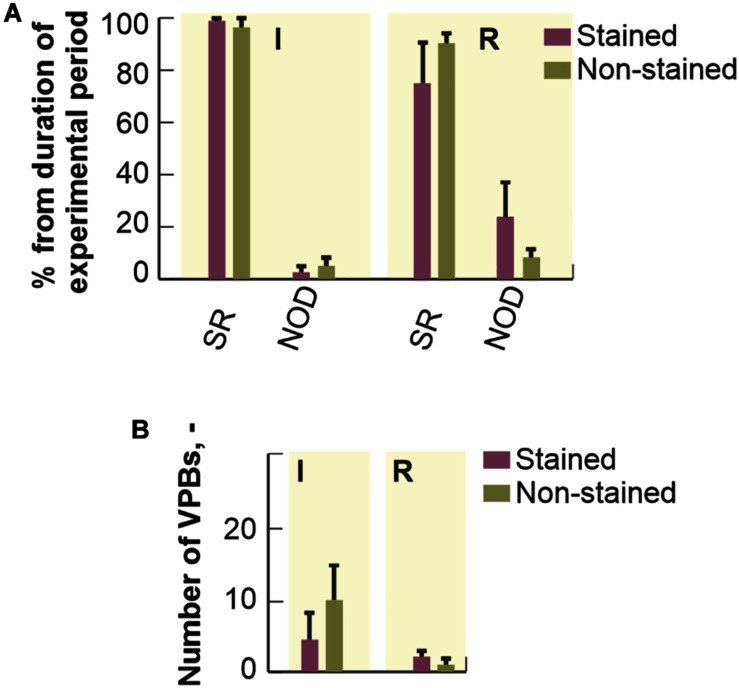
FIGURE 6.
Distribution of different cardiac rhythms throughout ischemia and reperfusion: expressed as a percentage of total duration of corresponding experimental period and shown as a bar with the top edge indicating mean value for the group and a whisker indicating SEM. (A) The distribution of a number of ventricular premature beats (VPBs): shown as a bar with the top edge indicating mean number of VPBs in the group and a whisker indicating SEM (B). SR, normal sinus rhythm; NOD, junctional rhythm; I, ischemia; R, reperfusion.

