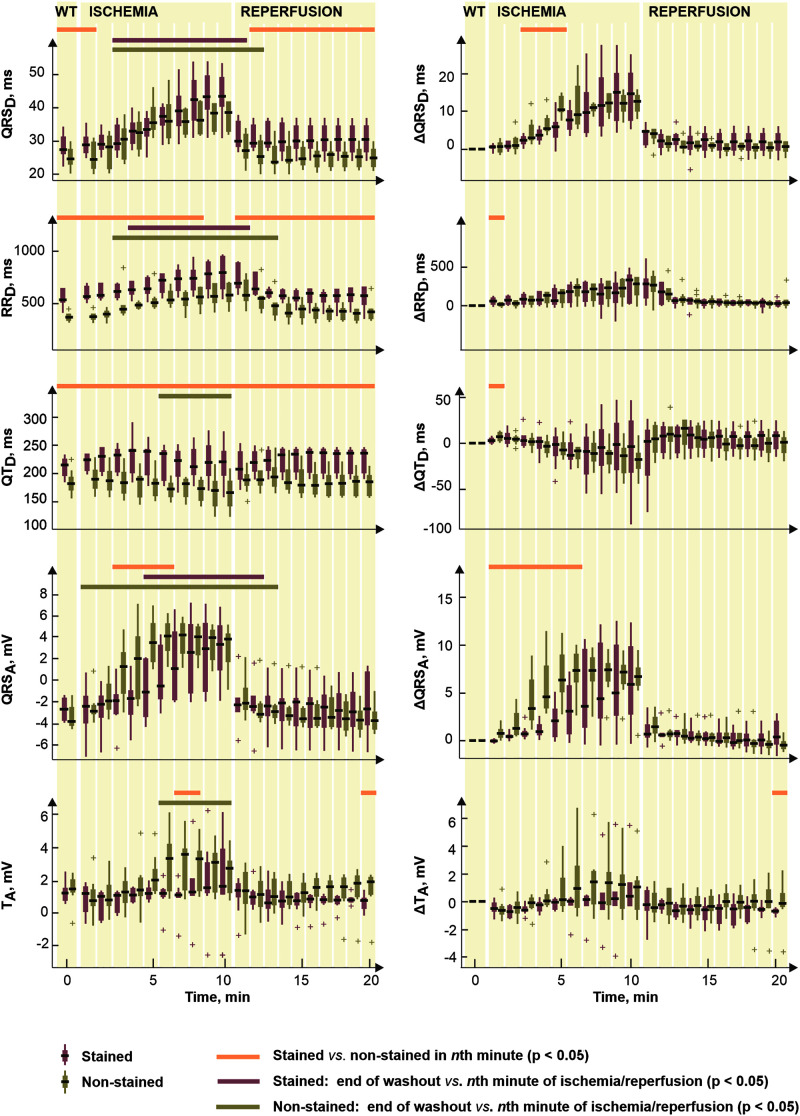
FIGURE 7.
Distributions of selected electrogram parameters (left) and corresponding corrected values Δ calculated by subtracting end-washout value from the current one (right). Shown for stained (n = 9) and non-stained (n = 11) hearts. QRSD, RRD, QTD, QRSA, and TA, duration of QRS complex, RR and QT intervals and maximal absolute QRS deviation and maximal deviation of ST-T interval, respectively. Displayed for end-washout (WT, according to the notation used in experimental protocol with di-4-ANEPPS) minute and every minute of ischemia and reperfusion as median; the edges of the box indicate 25th–75th percentiles. Horizontal lines indicate significant difference (p < 0.05) revealed via paired (not calculated for Δ values) and unpaired tests. “+” indicates outlier.

