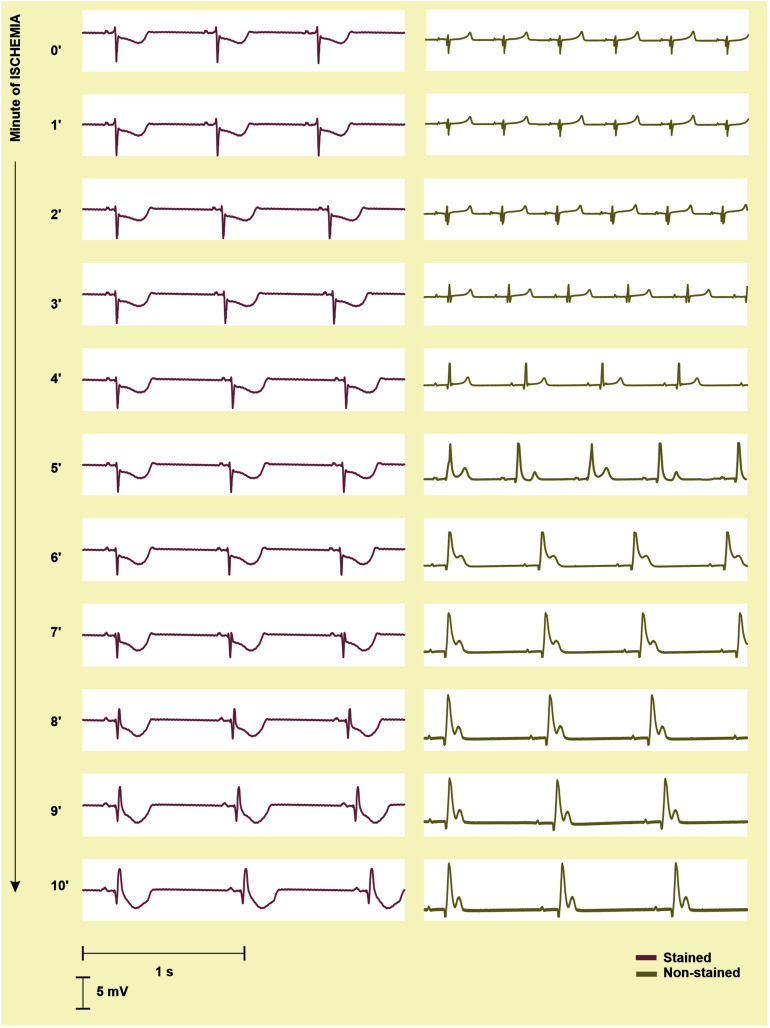
FIGURE 8.
Electrograms (EG) recorded before the onset (0′) and during 10-min ischemia in the stained (left) and the non-stained (right) rabbit isolated heart. In the stained heart EG, ischemia manifestations (inverted, increased and widened QRS, elevated/depressed ST, inverted T wave) appear in the 8th–9th minute, whereas in non-stained heart, the first ischemia-induced changes are obvious in EG from the 2nd–3rd minute. As a result, morphology of EG recorded in the stained and the non-stained heart significantly differs at the beginning and middle of ischemia and become similar at the end of the ischemia.

