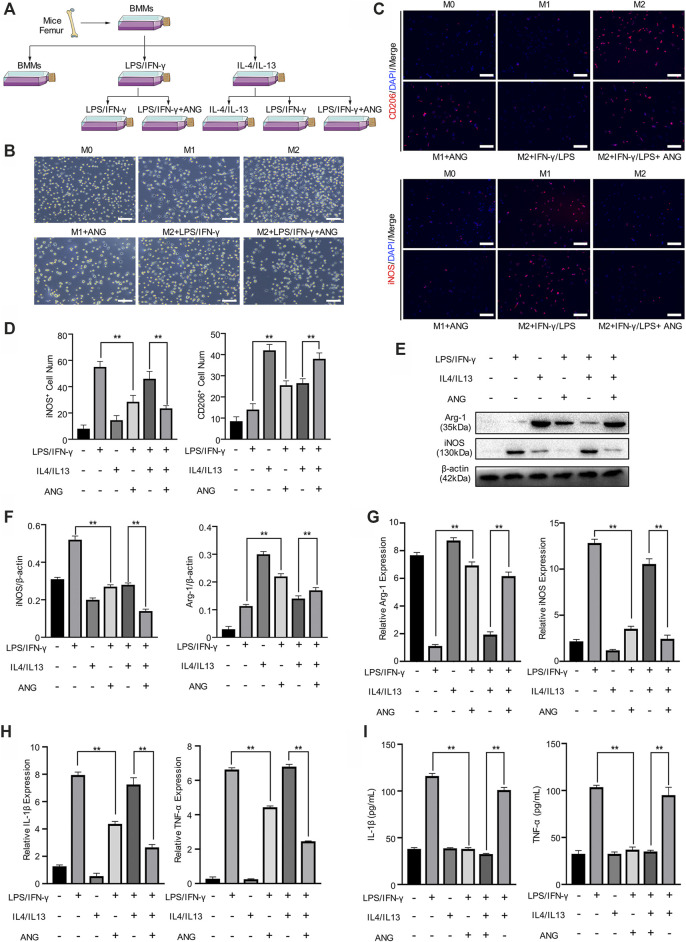
FIGURE 2.
Angelicin protectsM1 polarization and M2 macrophage polarization in vitro. (A) Schematic diagram of bone marrow macrophages (BMMs) isolation and macrophage M1/M2 polarization and repolarization strategy. (B) Representative morphology images in each group of three independent experiments. Bar represents 10 μm. (C, D) Immunostaining of enzyme-inducible nitric oxide synthase (iNOS) and CD206 (red) in isolated BMMs in different groups with quantification of iNOS+ and CD206+ cell numbers. (E, F) Western blot assay and qRT-PCR assay of Arg-1, iNOS and β-actin in BMMs. (G) qRT-PCR assay of IL-1β and TNF-α expression in BMMs. (H) ELISA for IL-1β and TNF-α concentration from cellular supernatant. The data in figures represents the mean ± SD. Significant differences are indicated as **p < 0.01. Scale bar represents 30 μm. DAPI, 4′,6-diamidino-2-phenylindole; IL, interleukin; LPS/IFN-γ, lipopolysaccharide/interferon-γ; ANG, angelicin.

