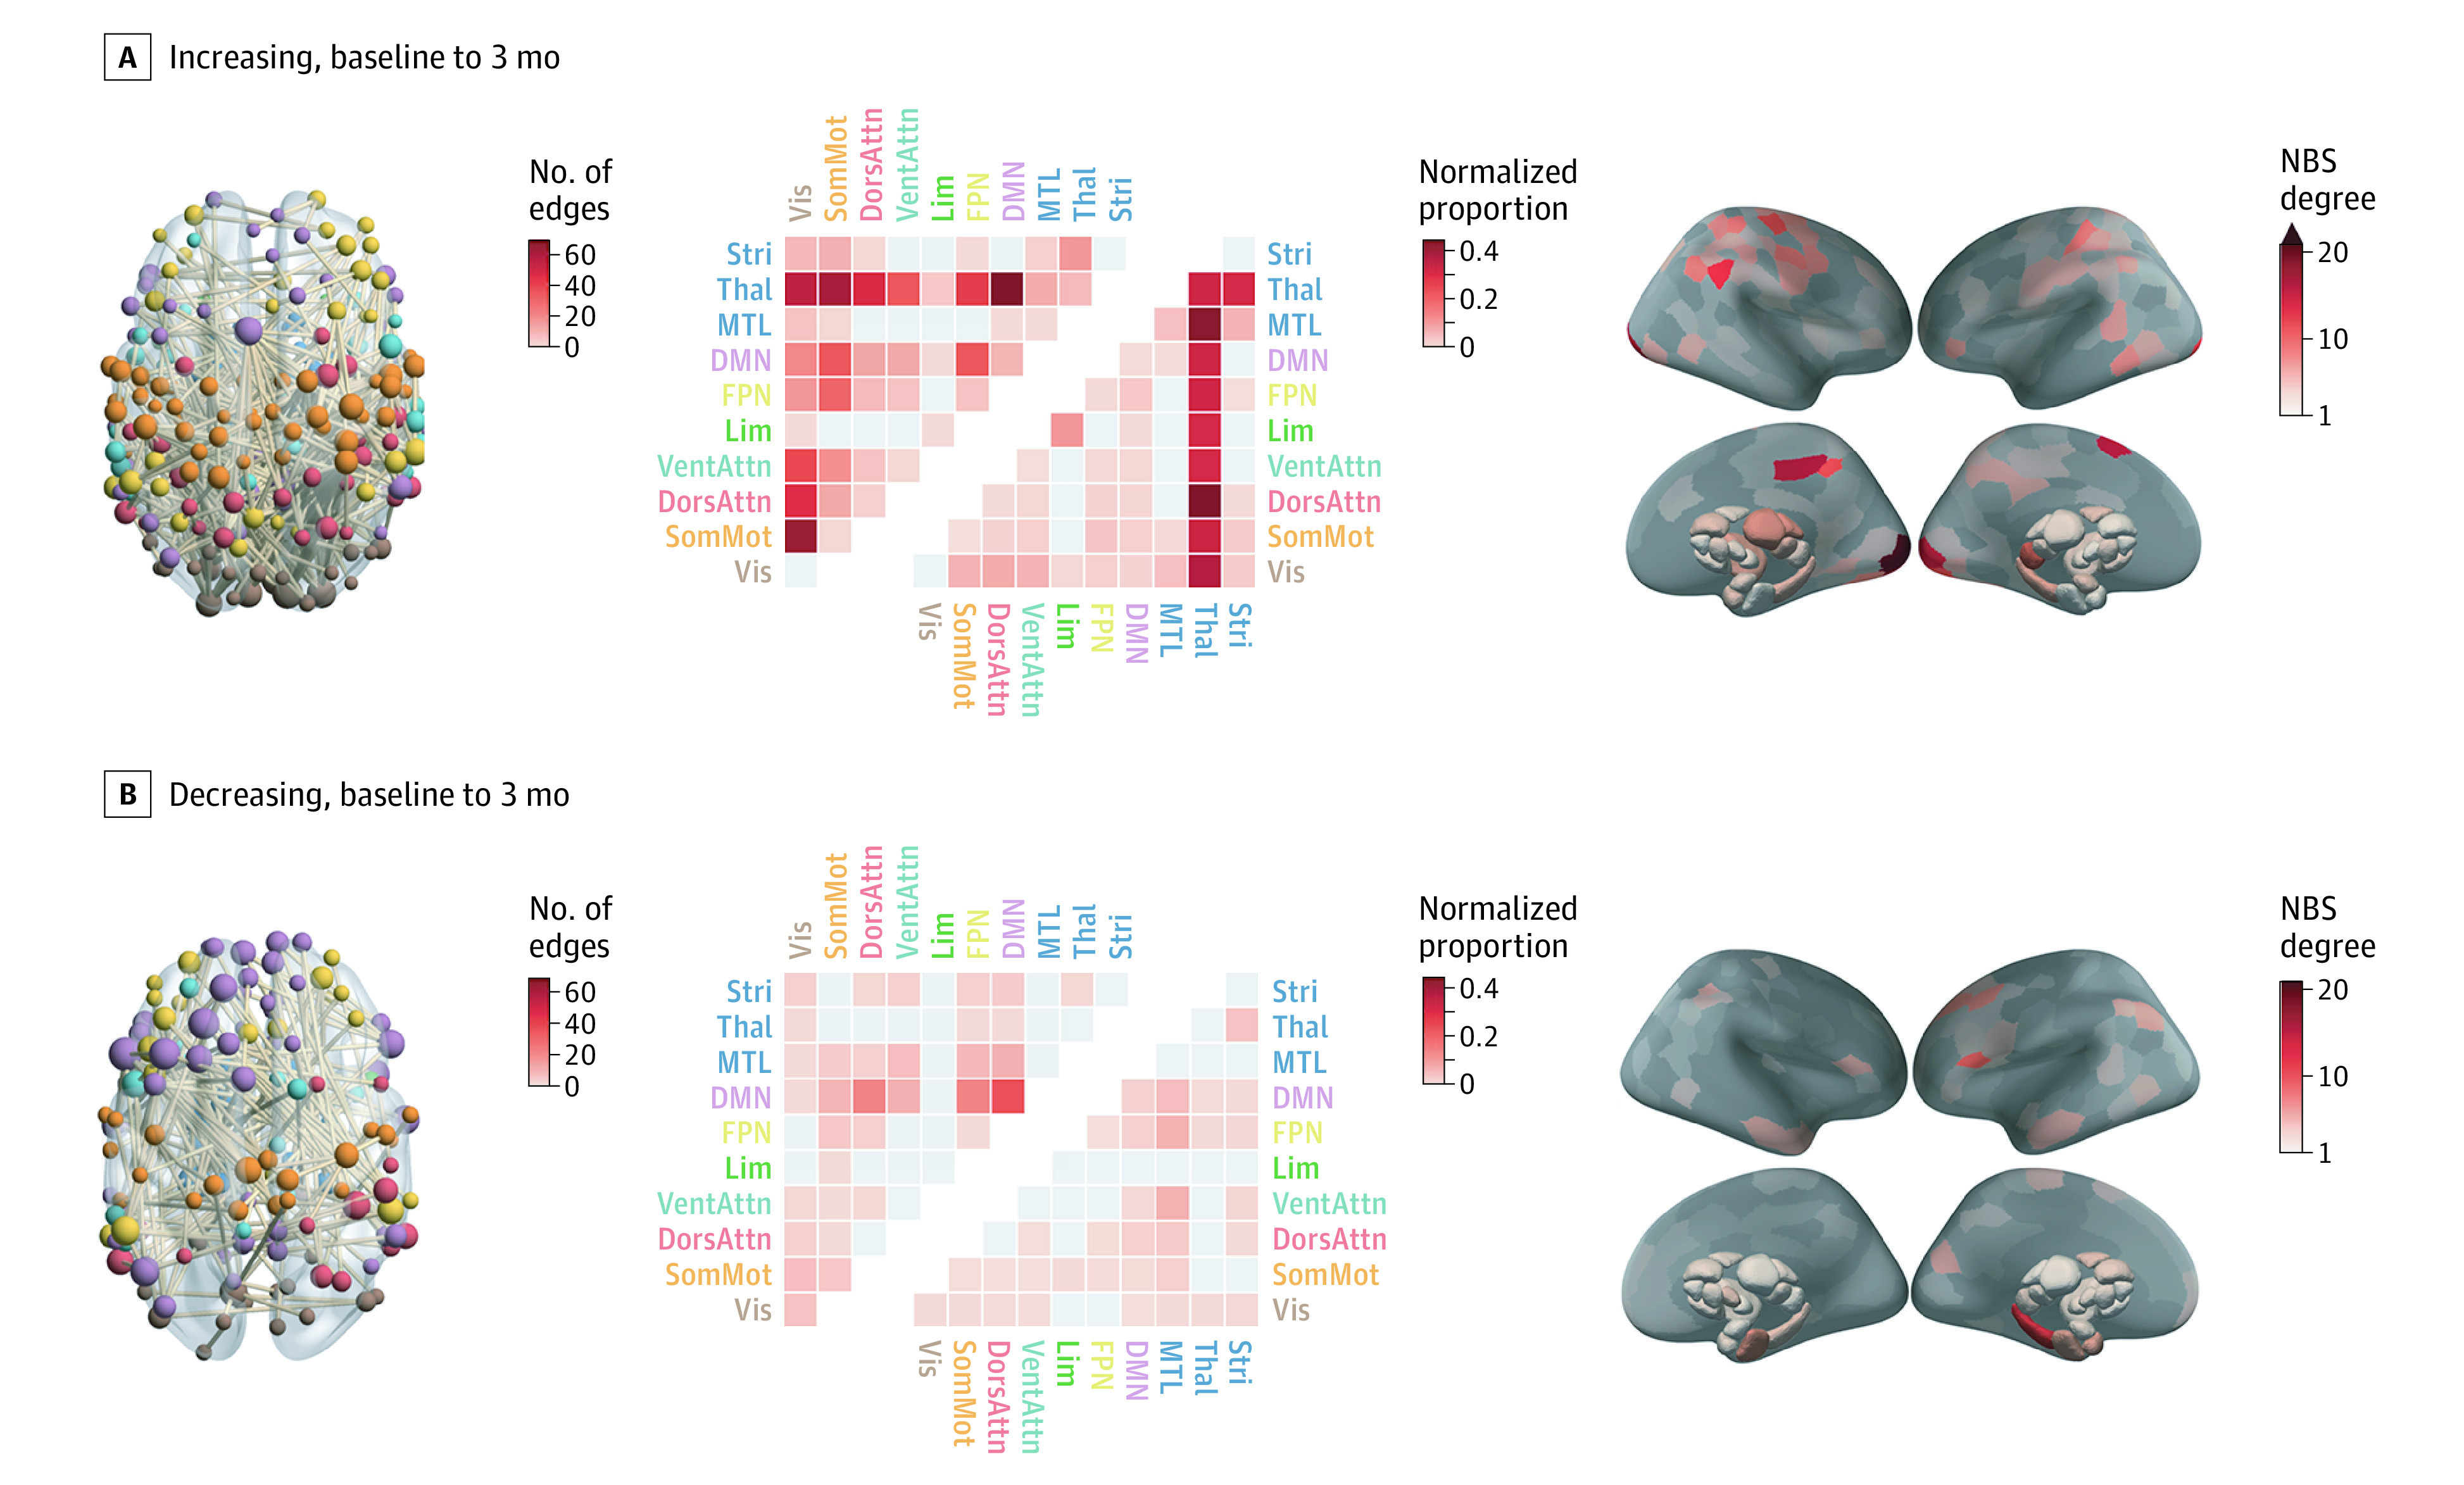
Figure 4. Longitudinal Functional Connectivity (FC) Changes Due to Antipsychotic (AP) Treatment.

Each panel shows changes from baseline to 3 months and contains (from left to right) (1) a visualization of the significant Network Based Statistic (NBS) subnetwork, with nodes colored by network and weighted by degree; (2) a heatmap of the proportion of edges within the NBS component that fall within each of the canonical networks, quantified using raw (upper triangle) and normalized (lower triangle) proportions; and (3) surface renderings depicted the number of edges in the NBS subnetwork attached to each brain region (NBS degree). DMN indicates default mode network; DorsAttn, dorsal attention network; FPN, frontoparietal network; Lim, cortical limbic network; MTL, medial-temporal lobe (amygdala and hippocampus); SomMot, somatomotor network; Stri, striatum; Thal, thalamus; VentAttn, ventral attention network; Vis, visual network.
