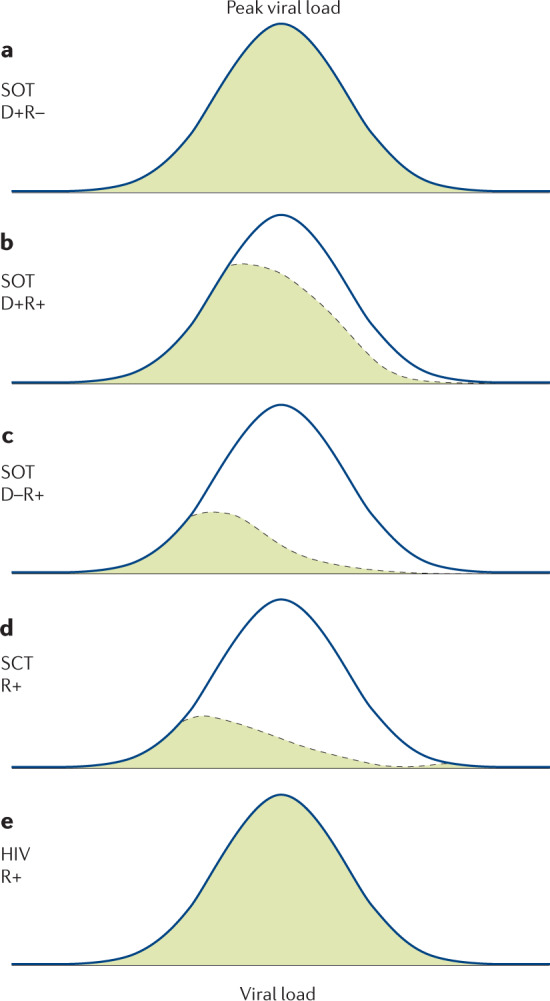
Fig. 4. Distribution of peak viral loads in immunocompromised individuals.

a | Peak viral loads approximate to a normal distribution in the donor positive–recipient negative (D+R–) solid organ transplantation (SOT) patient subgroup. b | By contrast, the distribution is shifted strongly to the left in the D+R+ subgroup where the recipient has natural immunity pre transplantation (green). c | Natural immunity does not prevent low viral loads resulting from reactivation (or either reactivation or reinfection (part b)). d | Following haematopoietic stem cell transplantation (SCT), the peak viral loads are relatively low yet patients in this subgroup have a high risk of end organ disease (EOD) (see Fig. 3). This shows that SCT patients are susceptible to a low viral load that would be unlikely to cause EOD in SOT. e | Individuals with HIV have a high viral load distribution, similar to that seen after D+R– SOT. Figure drawn using data provided in refs9,50,70,120–123.
