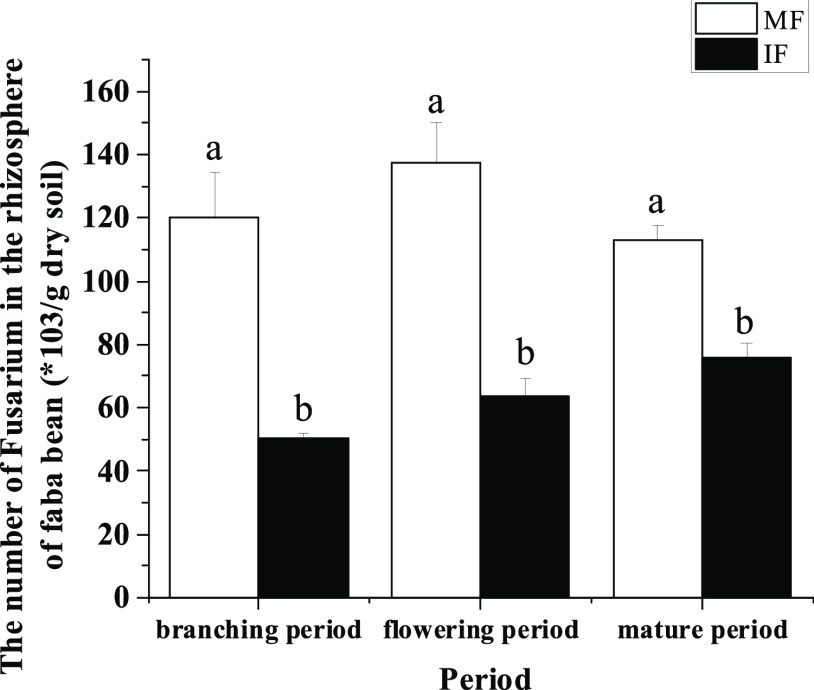
Figure 7.
Number of F. oxysporum propagules in the faba bean rhizosphere under different treatments in different periods. The data is an average, and the standard error of three repetitions is represented by a bar. Different letters for each index indicate significant differences at the p < 0.05 level.

