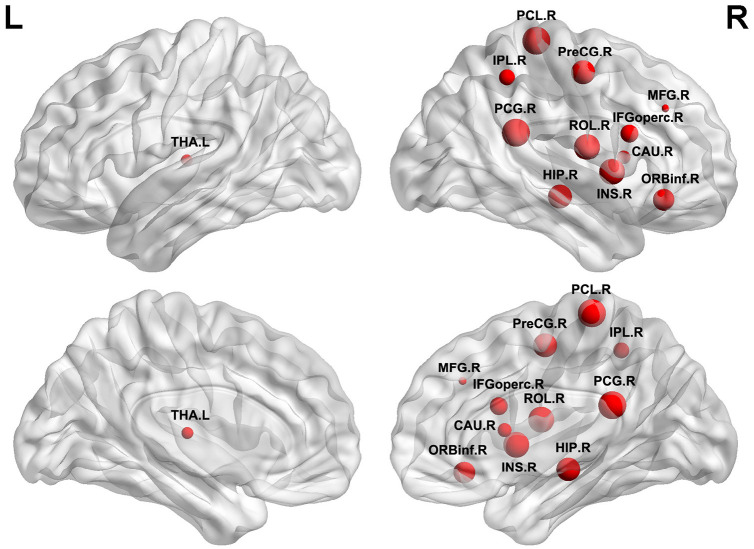
FIGURE 2.
Brain regions identified as abnormal nodal efficiency in ILA. Red nodes show the regions of reduced efficiency in patients with ILA relative to healthy controls. The node sizes denote the significance of between-group differences in the regional efficiency. For the abbreviations of nodes, see Supplementary Table 2. L, left; R, right.

