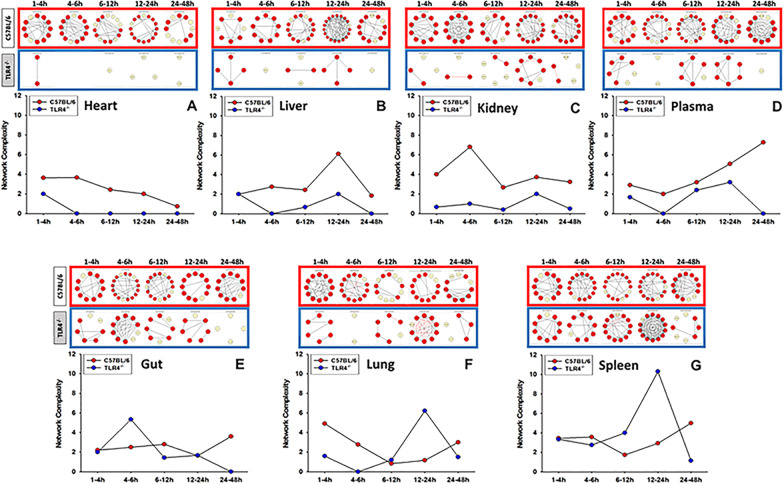
Fig. 1.
Dynamic Network Analysis of inflammatory mediators shows different network complexity in C57BL/6 and TLR4−/− mice. Animals were injected with LPS (3 mg/kg, i.p.). At different time points upon sacrifice, blood and different organs (liver, heart, gut, lung, spleen and kidney) were collected, inflammatory mediators were measured by Luminex™ and DyNA (stringency level = 0.7) was performed during each of the following five time frames: 1–4 h, 4–6 h, 6–12 h, 12–24 h, and 24–48 h as described in Section “Materials and methods”. Figure shows an overview of all the individual networks and mediator connections in both C57BL/6 and TLR4−/− mice during each time-frame for heart (Panel A), liver (Panel B), kidney (Panel C) plasma (Panel D), gut (Panel E), lung (Panel F), and spleen (Panel G). Circles in yellow represent mediators that changed significantly compared to baseline (0 h) but had no connections to other mediators. Red circles represent mediators that changed significantly compared to baseline and are connected to other mediators. Black and red arrows represent positive and negative connections, respectively

