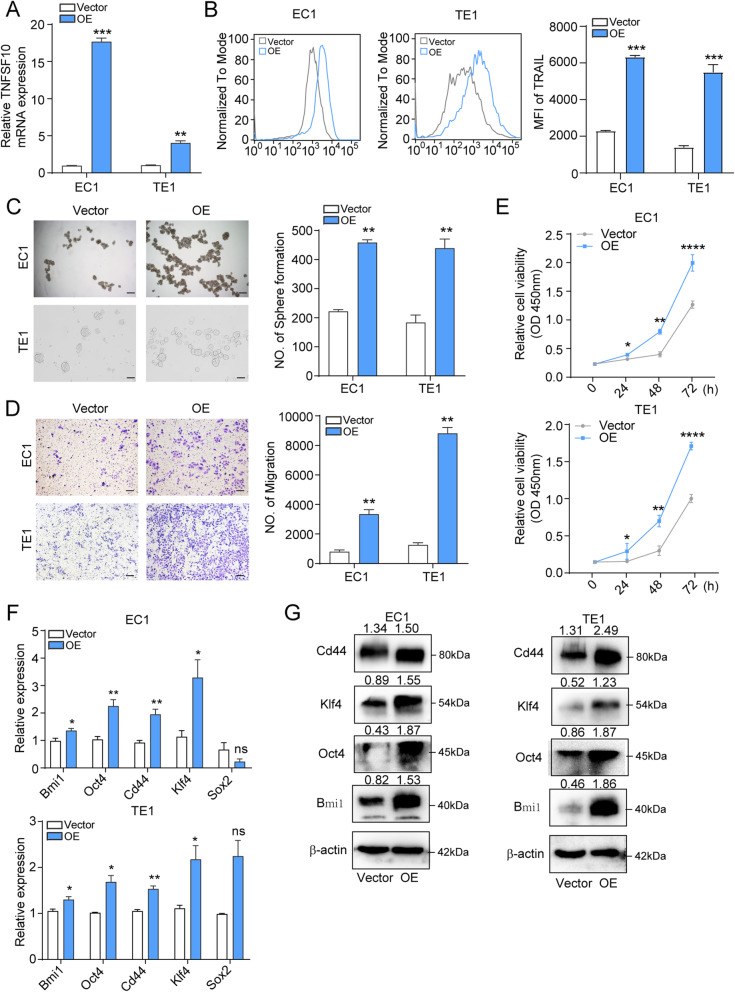
Fig. 3.
Overexpression of TRAIL promotes ESCC cell migration, invasion, and proliferation. a, b TRAIL overexpression effects in EC1 and TE1 cells were confirmed by RT-qPCR (left) and flow cytometry (right). c, d Sphere formation and transwell assays of TRAIL overexpression and control EC1 and TE1 cells. Representative images and quantitative analysis are shown in the left and right panels, respectively. e CCK-8 assay to determine cell proliferative capacity of EC1 (top) and TE1 (bottom) cells. f, g RT-qPCR and western blot of cell stemness-related genes. NC, negative control. The data are presented as the mean ± SD. ****P < 0.0001, ***P < 0.001, **P < 0.01, *P < 0.05 (unpaired t-test)

