
Figure 6:
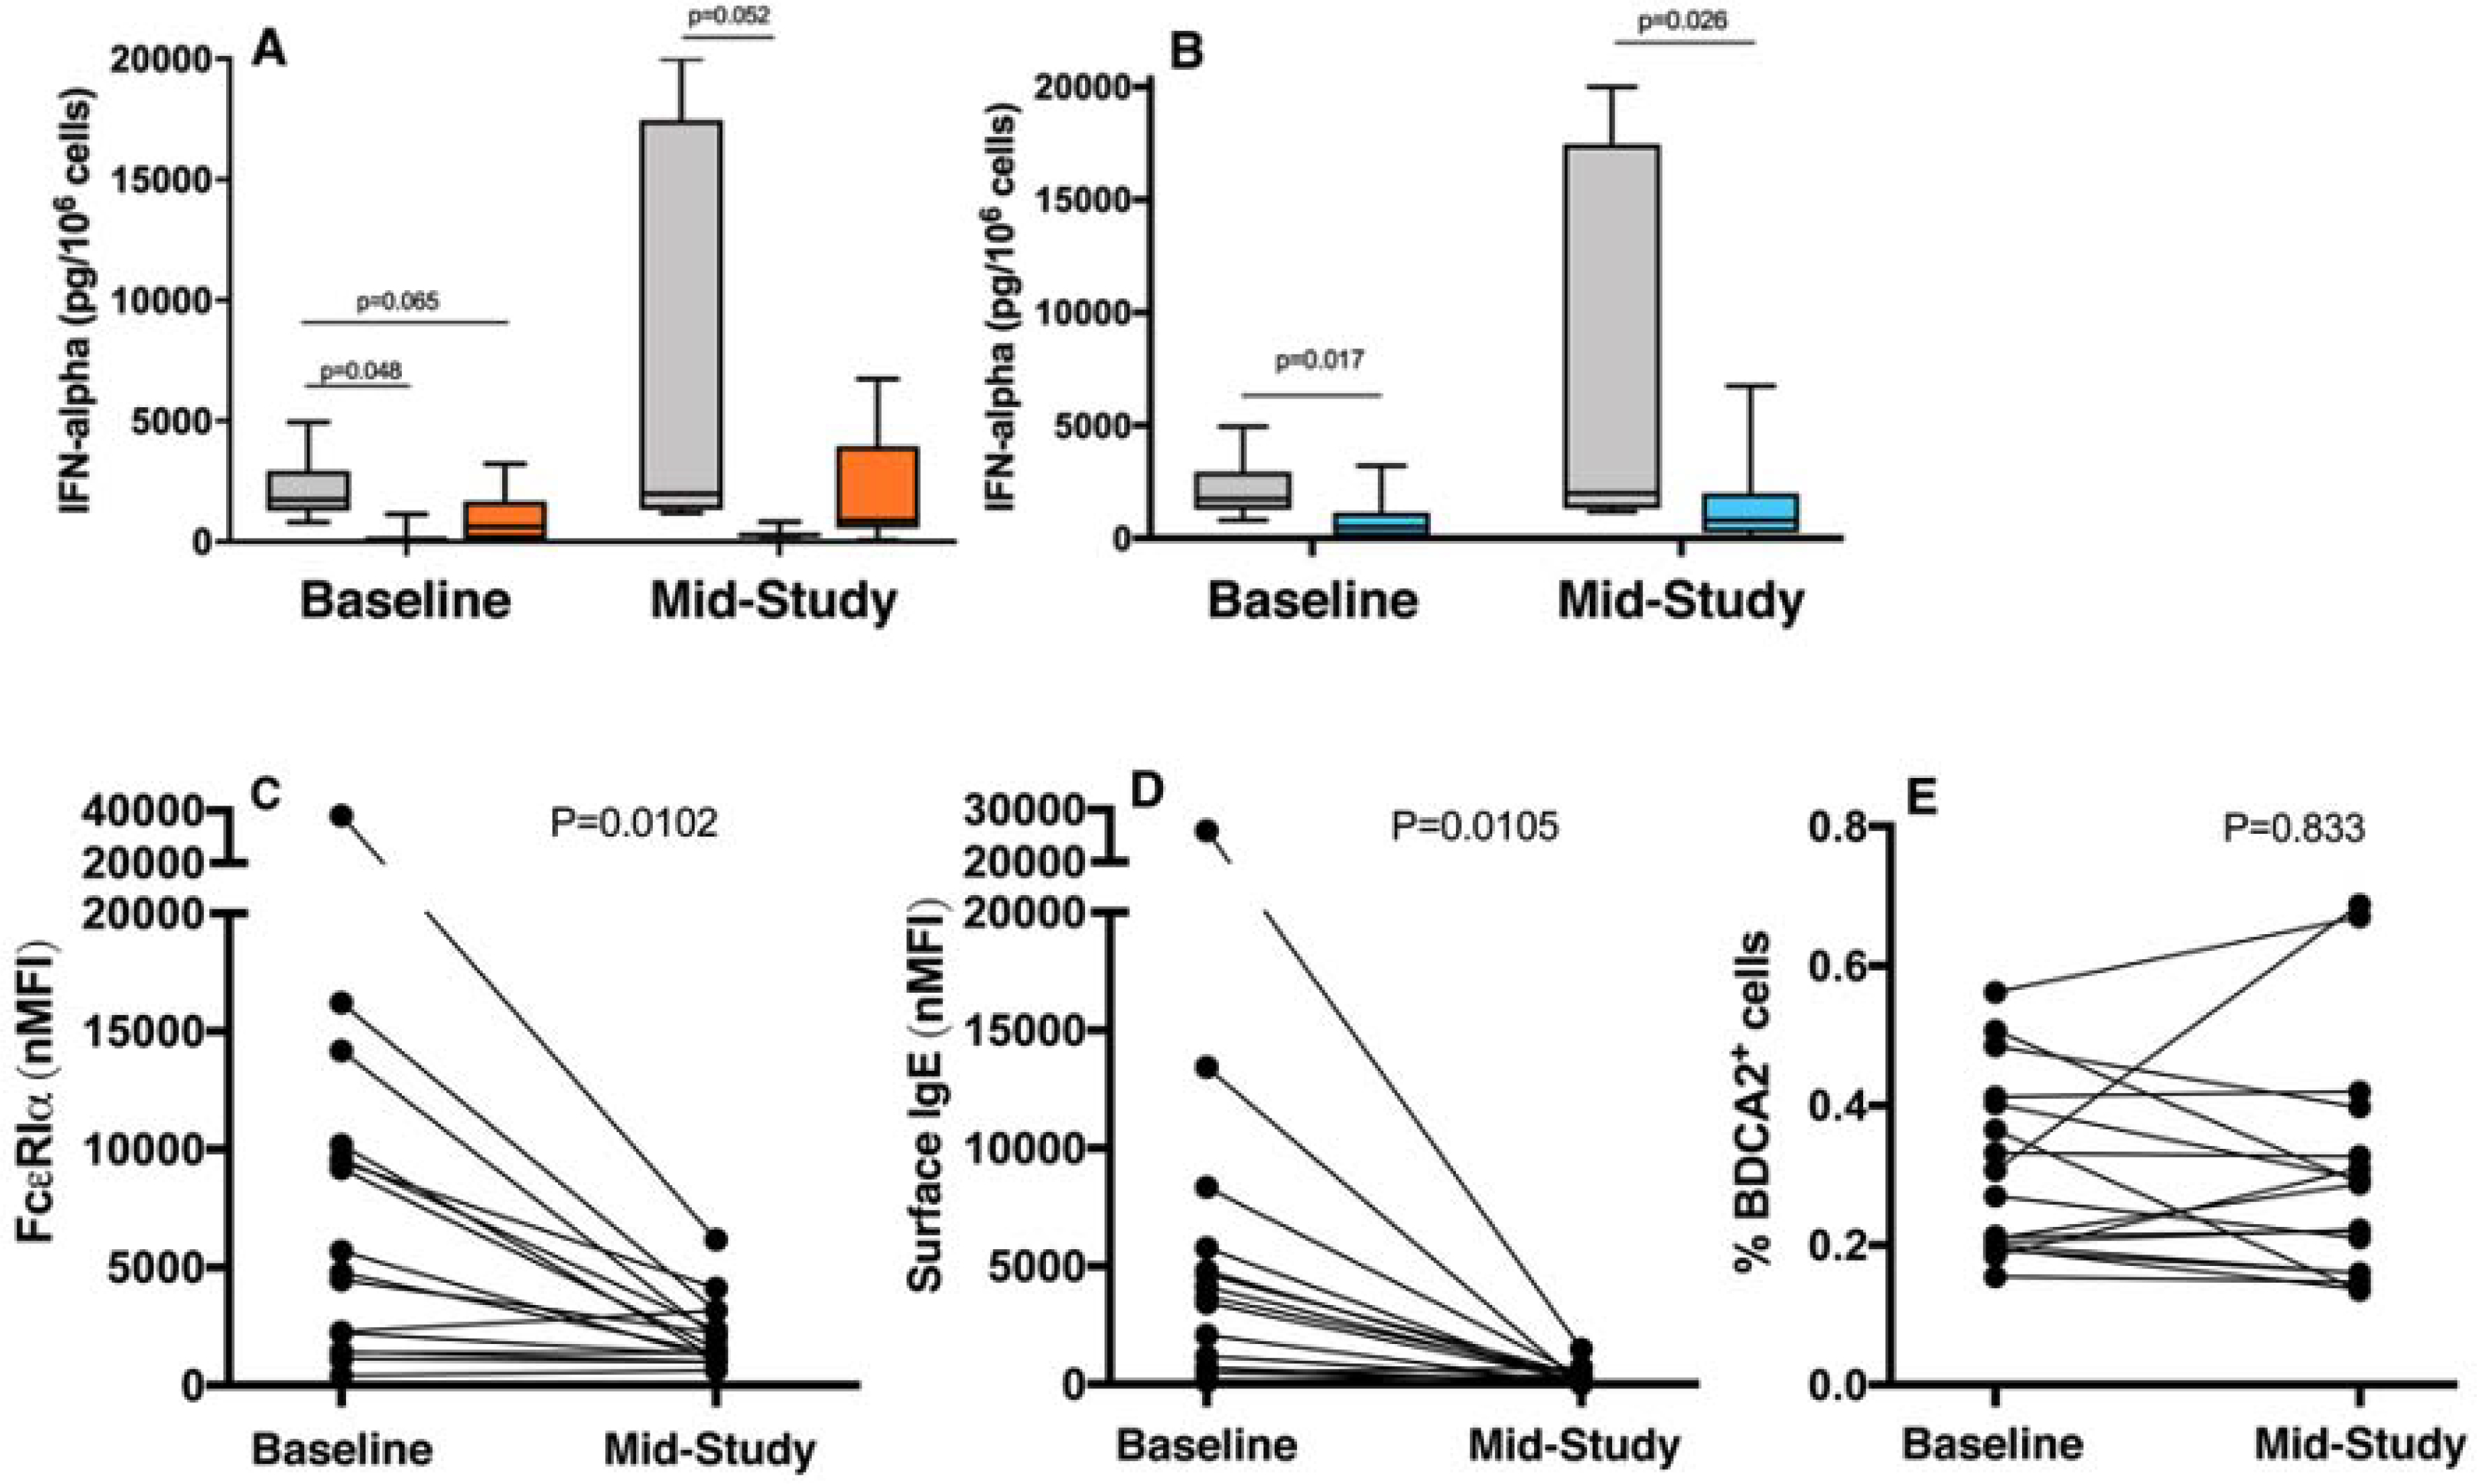
TLR9-mediated secretion of IFN-α, in vitro, from isolated pDCs at baseline and at mid-study measurement. Grouped by dual parameter basophil classifications (A):CSU-R/NB (n=6, grey bar), CSU-NR/NB (n=3, blue bar), NR/B (n=6, orange bar). (B): CSU-R (n=6, grey bar), CSU-NR (n=9, blue bar). (C) FcεRI (D) surface IgE, and (E) percent BDCA2+ pDC by flow at baseline and mid-study timepoints.