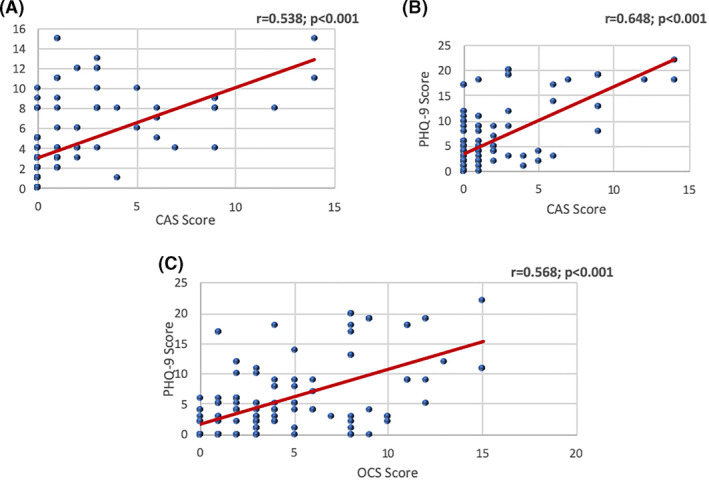
FIGURE 1.

A, Correlation between CAS and OCS scores. The correlation between the CAS and OCS score was positively and highly statistically significant (r = .538; P < .001) suggesting that when the CAS increases the OCS will also likely increase. B, Correlation between the CAS and PHQ‐9, which was positively and highly statistically significant (r = .648; P < .001), indicating that as the CAS increases the PHQ‐9 will also increase. C, There was a positive and highly statistically significant correlation between OCS and PHQ‐9 scores (r = .568; P < .001), which suggests that when the OCS score increases the PHQ‐9 score will also likely increase
