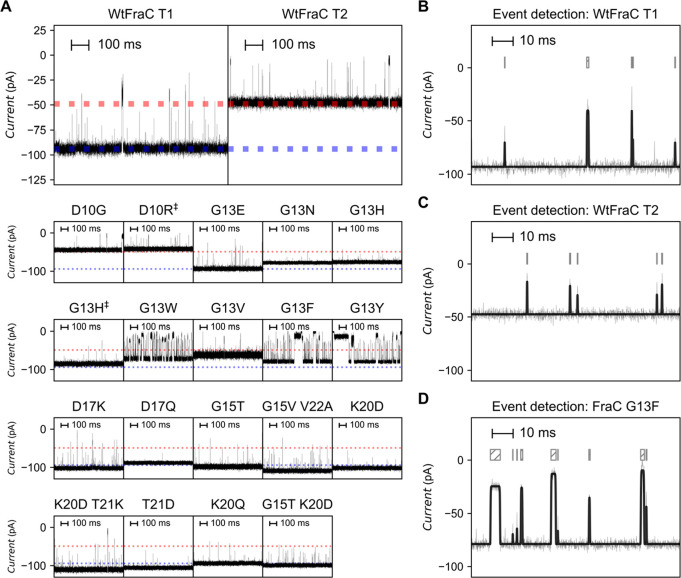
Figure 2.
Electrophysiology recordings of (mutant) fragaceatoxin C with trypsin-digested lysozyme. (A) Representative traces of fragaceatoxin C nanopores after addition of an equal concentrations of trypsin-digested lysozyme under an applied potential of −50 mV. The dotted blue line represents the baseline current of the octameric (T1) form of wild-type fragaceatoxin C; the dotted red line represents the baseline current of the heptameric (T2) form of wild-type fragaceatoxin C. (B–D) Representative trace of octameric fragaceatoxin C (T1, B), heptameric fragaceatoxin C (T2, C), and fragaceatoxin C mutant G13F (D). The gray line represents the recorded trace, and the black superimposed line represents the fit after event detection. The block above the trace aligns with the length of the events. Traces were collected in 1 M KCl and 50 mM citric acid titrated with bis-tris propane to pH 3.8 at a sampling frequency of 50 kHz, using a 10 kHz Bessel filter and 5 kHz Gaussian filter.

