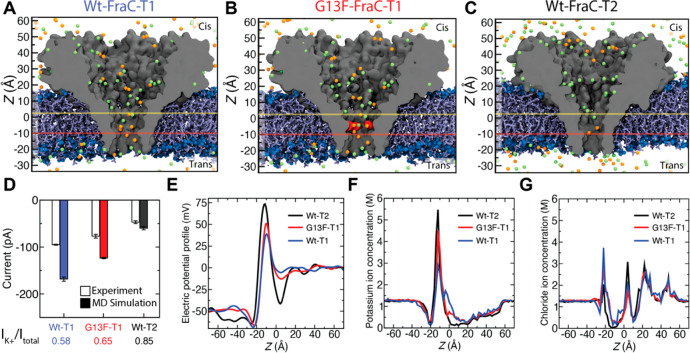
Figure 6.
Molecular dynamics simulation of mutant fragaceatoxin C nanopores. (A–C) All-atom models of WtFraC-T1 (A), G13F-FraC-T1 (B), and WtFraC-T2 (C) nanopores. The protein is shown as a gray cutaway surface, embedded in a DPhPC lipid bilayer (blue). The G13F mutation site in panel b is shown in red. All systems contain 1 M KCl solution (potassium in orange and chloride in green, water not shown). The protonation states of the titratable residues are set to reflect the pH of 3.8. The z axis is shown on the left for scale. Yellow and red horizontal lines show the position of the electrostatic minima and maxima, respectively. (D) Experimental and simulated open pore currents at −50 mV for the three systems. The simulated values reflect scaling of the raw MD current with the ratio of the experimental and simulated bulk conductivity of 1 M KCl. The error bars represent the standard error computed by splitting the MD trajectories into 10 ns fragments and considering each fragment as an independent measurement of the current. The contribution of the potassium ion to the MD current is specified at the bottom. (E) Average electrostatic potential along the symmetry axis (z axis) of the three pores. (F, G) Profiles of potassium (F) and chloride (G) ion concentration along the symmetry axis of each nanopore.

