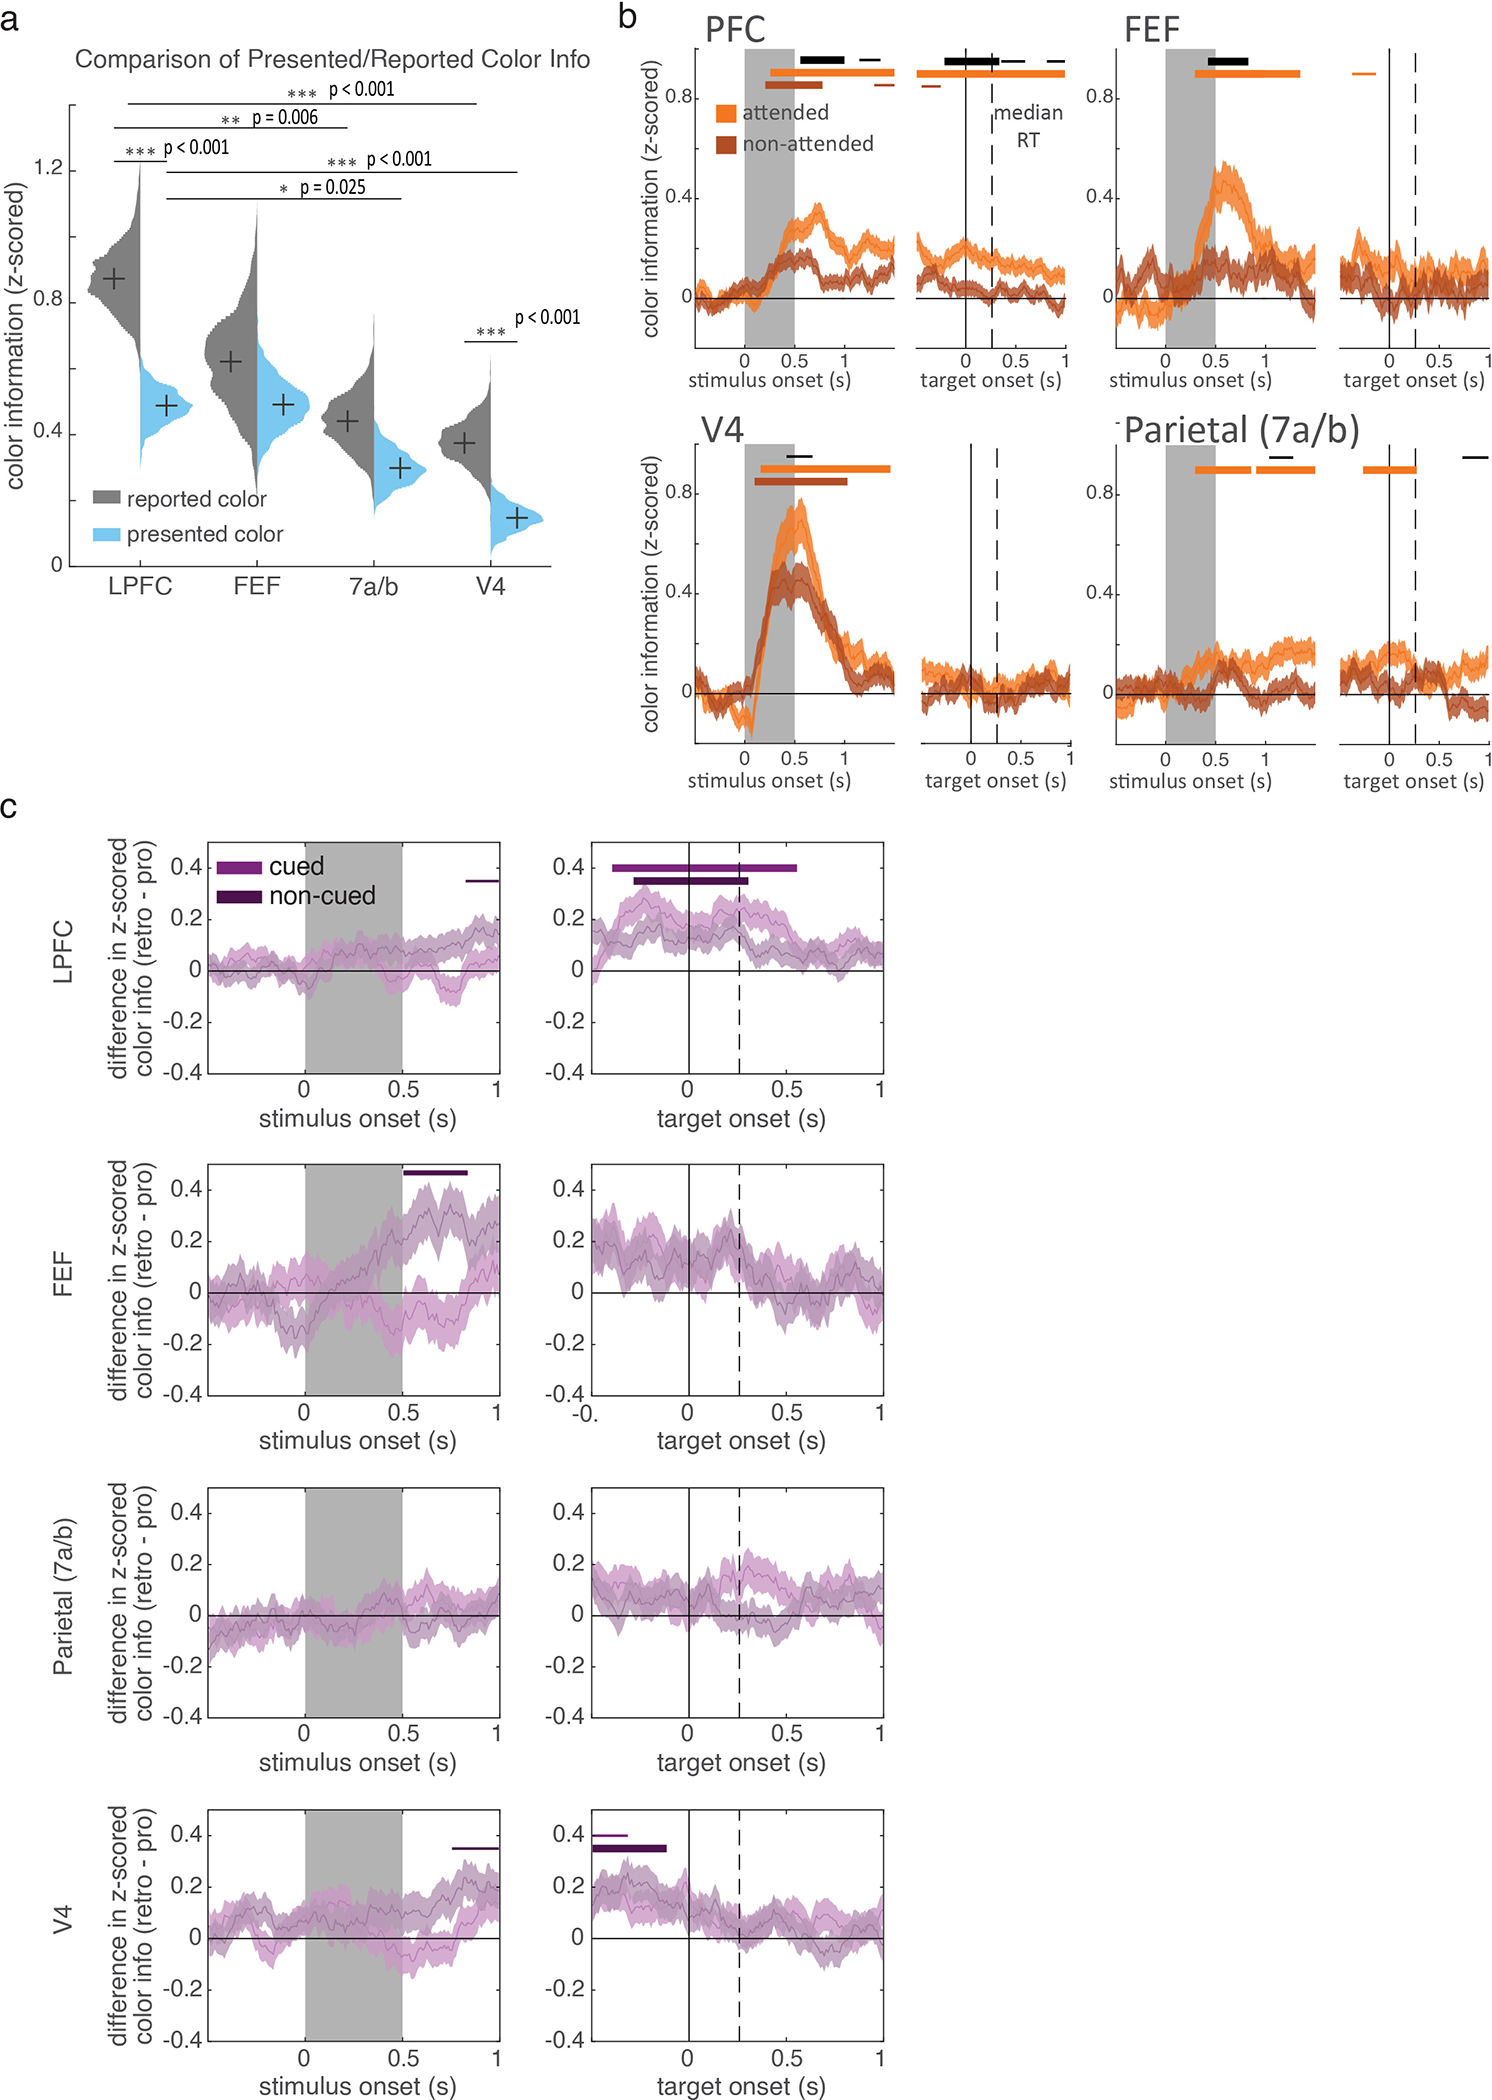
Extended Data Figure 6.

(a) Mean z-scored color information for the reported color (gray) and the color of the presented, selected, item (light blue). Information was calculated on firing rates in a 200 ms window prior to onset of the response color wheel for all neurons. Distributions show bootstrapped estimates of the mean across neurons (LPFC: 570 neurons, FEF: 163 neurons, parietal: 292 neurons, V4: 311 neurons). Horizontal lines indicate pairwise comparisons. * p<0.05, ** p<0.01, *** p<0.001 (two-sided uncorrected randomization tests). (b) Mean z-scored color information for the attended and non-attended color on pro trials. Error bars are STE across neurons (LPFC: 543 neurons, FEF: 160 neurons, parietal: 272 neurons, V4: 300 neurons). Horizontal bars indicate significant information for the attended item (light orange), the non-attended item (dark orange), and significant differences in information about the attended and non-attended items (black). Bar width indicate significance: p<0.05, 0.01, and 0.001 for thin, medium, and thick, respectively (two-sided cluster-corrected t-tests). (c) Difference in z-scored color information between retro and pro trials for the cued item (selected - attended; light purple) and uncued item (non-selected - non-attended; dark purple). Positive values reflect more information about an item on retro trials. Error bars are STE across neurons (LPFC: 511 neurons, FEF: 146 neurons, parietal: 258 neurons, V4: 285 neurons). Horizontal bars indicate significant differences from zero (i.e. differences between retro and pro) for the cued item (light purple) and the non-cued item (dark purple). Bar width indicate significance: p<0.05, 0.01, and 0.001 for thin, medium, and thick, respectively (two-sided cluster-corrected t-tests).
