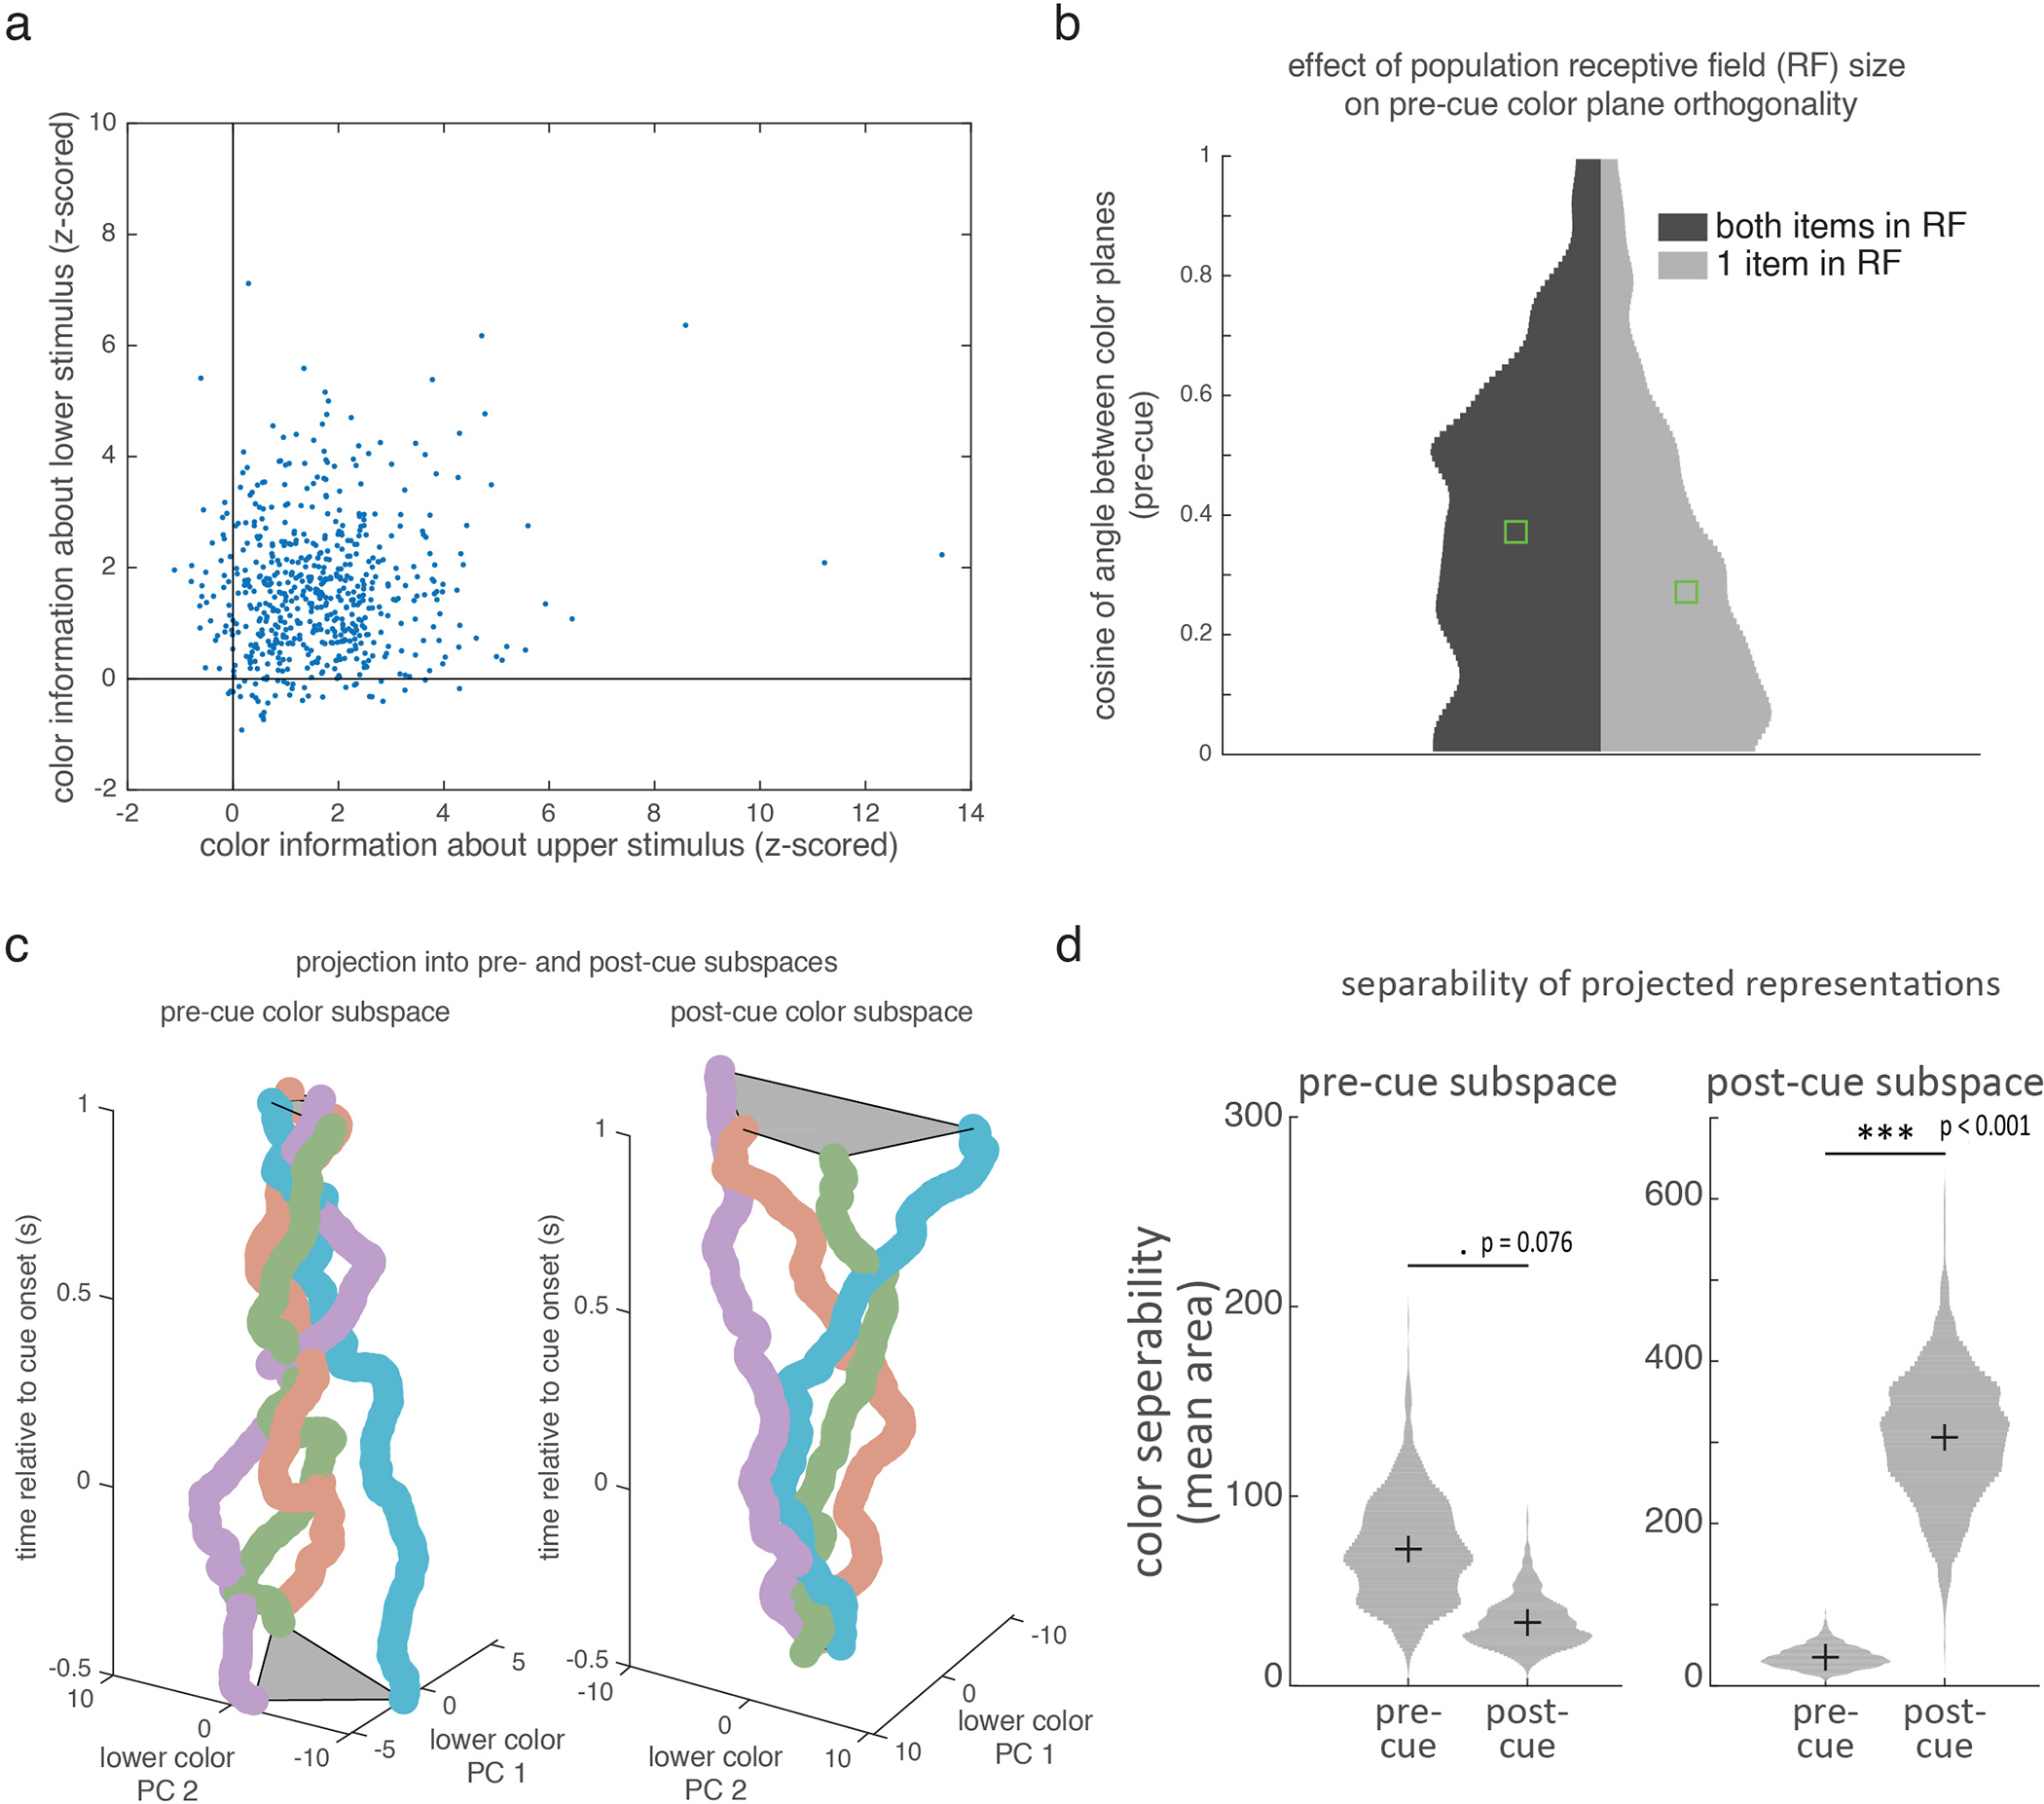
Extended Data Figure 8.

(a) Mean z-scored color information for the upper (x-axis) and lower (y-axis) stimuli immediately prior to selection cue onset (average over −500 to 0 ms before the selection cue) for LPFC (583 neurons). As shown in the scatterplot, most neurons carried some amount of information about both items (i.e., neurons did not lie along the axes). (b) To check if neurons primarily carrying information about just one item were driving the orthogonality between the color planes in LPFC before the selection cue, we re-computed the cosine of the angle between the color planes (see methods) using populations of neurons with significant color information about one item only (“1 item”) or both items (“both”; see methods for description of this test). Histograms show distribution of the cosine of the angle between the best-fitting planes for the upper and lower stimuli during the pre-cue period for these ‘both’ and ‘1 item populations of neurons (with each population subsampled to an equal number of neurons, see methods). Distributions were estimated from 1000 resamples of trials. Green squares indicate median values. While the “both” neurons did display slightly less orthogonality than the “1 item” neurons, this difference was not significant (p > 0.4, two-sided bootstrap of difference). Note that cosine angles are not zero for “1 item” neurons because 1) ‘1 item’ neurons still contain subthreshold information (p > 0.05) about the other item, as seen in panel A, and 2) subsampling cells in this way decreases statistical power, inflating low cosine values. (c) Population trajectories for ‘lower’ colors, over time, as projected into the ‘lower’ color subspace defined either before or after selection (left and right plots, respectively). Follows Fig. 4e. Lower color subspace was defined as a 2D space that maximally explained variance across the four ‘lower’ colors (see methods). As for the ‘upper’ color (shown in Fig. 4e), temporal cross generalization was poor, suggesting the color information was represented in a different subspace before and after the selection cue. (d) Before selection, color representations in LPFC are better separated using the pre-selection subspace. After selection, colors are better separated in the post-selection subspace. Separability was measured as the area of the quadrilateral defined by the responses to colors (shown in panel c and Fig. 4e), projected into either the pre-selection or post-selection subspaces (left and right columns in each plot; area averaged across upper and lower items). Violin plots show distributions estimated from 1000 resamples of trials. * p<0.05, ** p<0.01, *** p<0.001 (two-sided bootstrap of difference).
