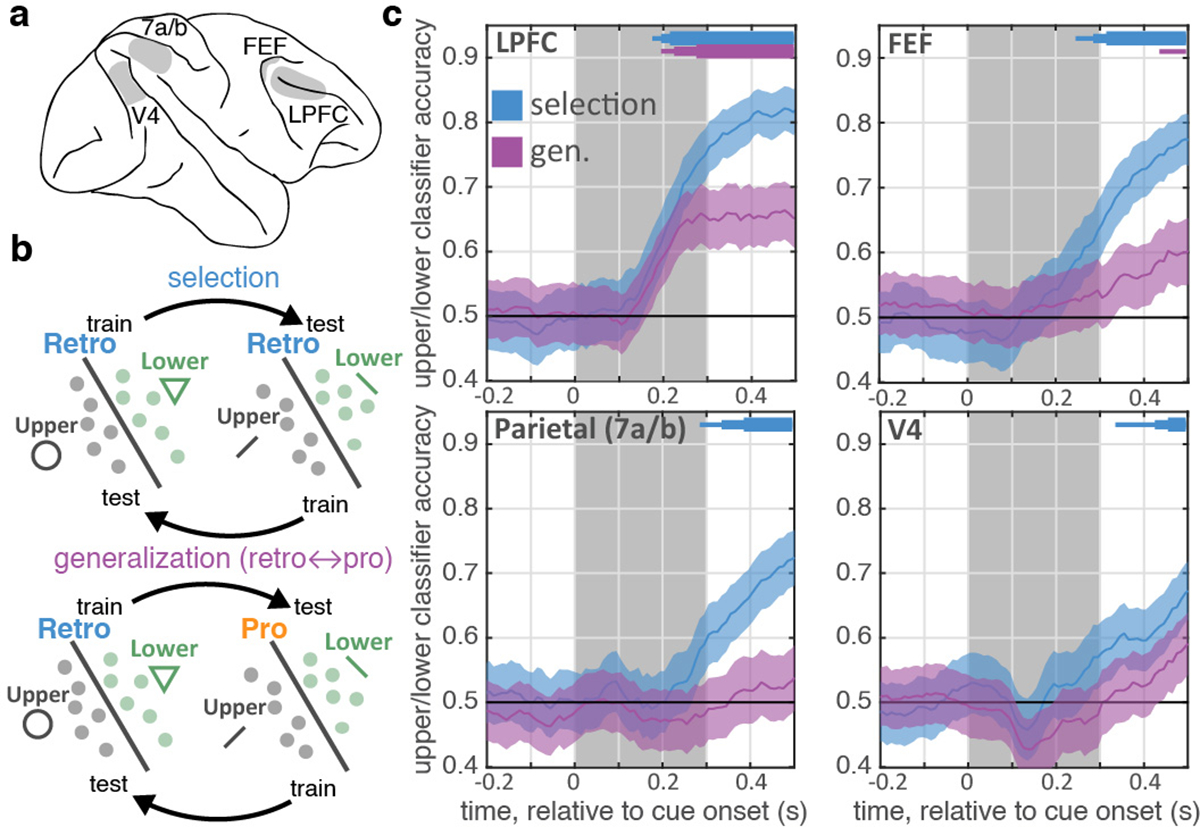
Figure 2.

Selection is observed first in prefrontal cortex and shares a population code with attention. (a) Schematic of neural recordings. (b) Schematic of classifiers used to quantify information about whether the upper or lower item was selected from population firing rates (see methods). ‘Selection’ classifier accuracy was measured within retro trials (left) on held-out data. ‘Generalization’ classifier accuracy was measured across retro and pro trials (right). (c) Timecourse of classifier accuracy for each brain region (labeled in upper left). Lines show mean classification accuracy (shaded region is +/− STE), around cue onset, for the selection (blue) and generalization classifiers (purple). Distribution reflects 1,000 iterations of classifiers, trained/tested on N=60 randomly-sampled trials. Horizontal bars indicate above-chance classification: p<0.05, 0.01, and 0.001 for thin, medium, and thick lines, respectively; one-sided uncorrected bootstrap.
