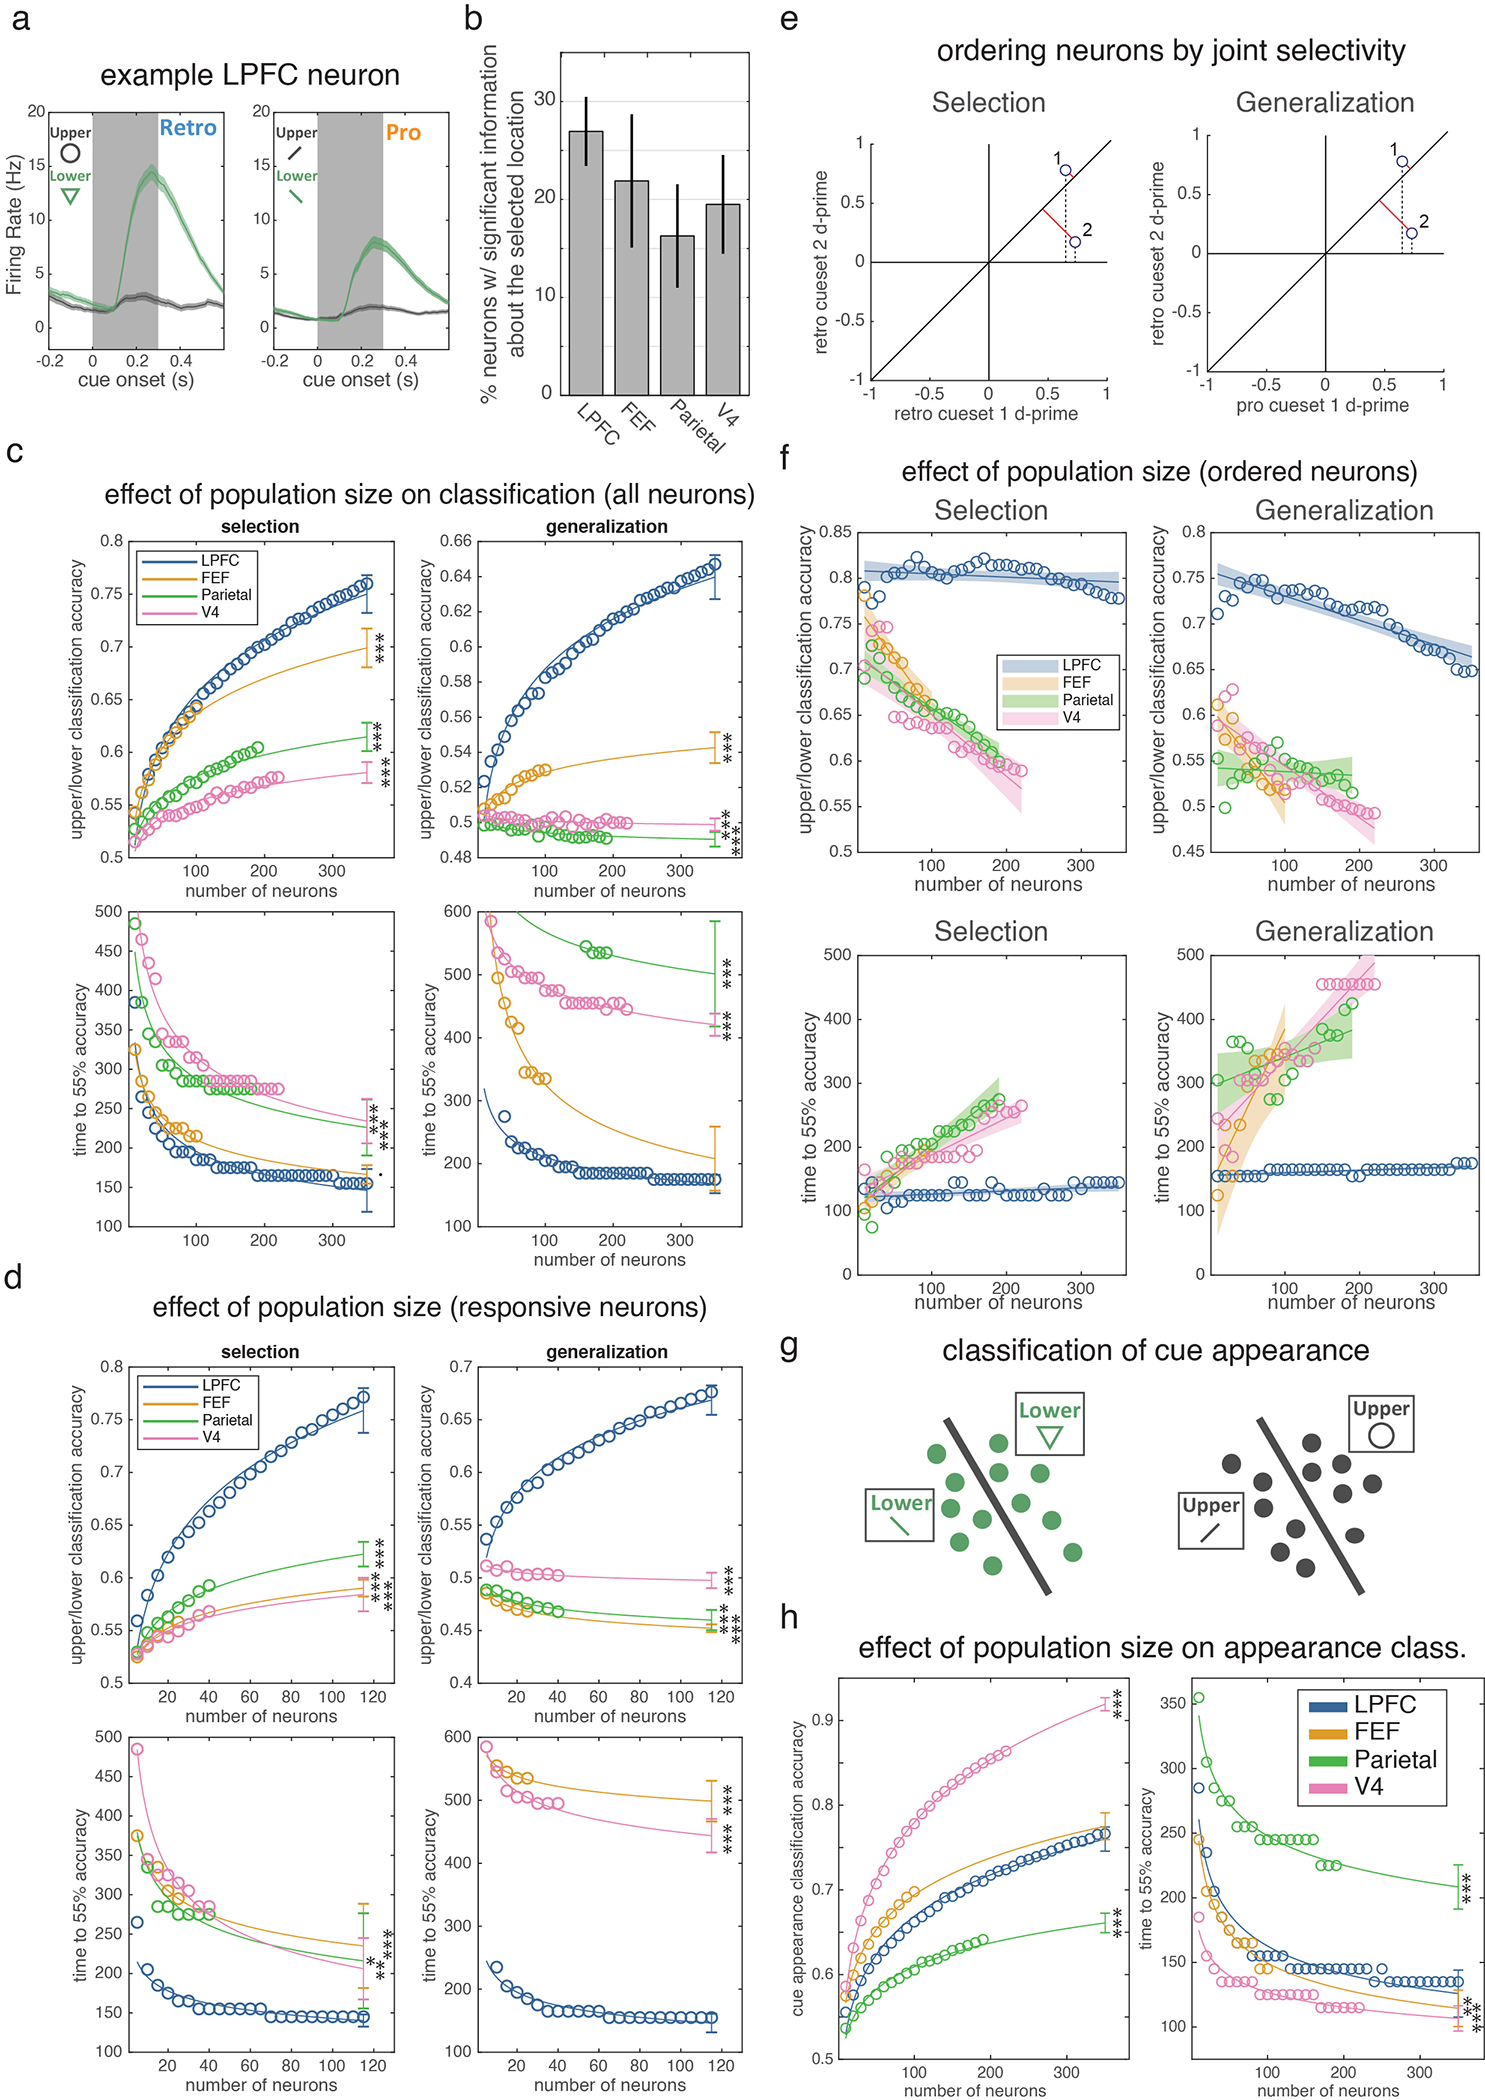
Extended Data Figure 2.

(a) Firing rate of an example LPFC neuron around cue onset when the upper (gray) or lower (green) stimulus was cued in the retro (top) and pro (bottom) conditions. Shaded regions are STE across trials (N = 161 retro upper, 124 retro lower, 150 pro upper, and 121 pro lower trials). Inset shows different cues used for retro and pro trials. (b) Percent of neurons in each region of interest with firing rates that were significantly modulated by the selected location after cue onset on retro trials (trials pooled across cue set 1 and 2). For each neuron, we quantified location selectivity using d-prime (see methods) and compared this value to a null distribution by permuting location labels across trials. All four regions showed strong selectivity: LPFC had 159 out of 590 neurons selective; FEF: 37/169, 7a/b: 49/301, V4: 62/318, all p<0.001 against chance of 5% (two-sided uncorrected binomial test). (c) Mean classification accuracy (top, taken at 300 ms post-cue) and mean time to 55% classification accuracy (bottom) for the selection (left) and generalized (right) classifiers as a function of the number of neurons used for classification. This analysis controls for the total number of neurons recorded in each region. For each subpopulation of a specific size (x-axis), circles reflect average across 1,000 iterations using different randomly selected subpopulations of that size. Lines reflect best-fitting two-parameter power function (see methods). Error bars are 95% prediction intervals. For classifier accuracy (top row): N=35, 10, 19, and 22 unique population sizes for LPFC, FEF, parietal and V4, respectively. For classifier timing (bottom left/right): N=35/32, 10/8, 19/4, and 21/20 for selection/generalization in LPFC, FEF, parietal and V4, respectively. The reduction in number of data points in the bottom plots reflects the fact that, for some neuron counts, classifiers never reached 55% classification accuracy on any iteration. Asterisks indicate significance of projected classification for a given region compared to the measured classification in LPFC at the maximum number of neurons (two-sided z-test, not corrected for multiple comparisons). Selection Classification Accuracy: FEF p=2.18e-10, Parietal p=1e-16, V4 p<1–16. Generalization Classification Accuracy: FEF p<1e-16, Parietal p<1e-16, V4 p<1e-16. Selection Classification Timing: FEF p=0.054, Parietal p=1.02e-4, V4 p<6.94e-8. Generalization Classification Timing: FEF p=0.203, Parietal p=1.11e-13, V4 p<1e-16. (d) Neuron dropping curves as in panel c, except analysis was restricted to neurons with a significant evoked response to cue onset in order to control for potential differences in responsiveness across regions (see methods). For classifier accuracy (top row): N=23, 5, 8, and 8 unique population sizes for LPFC, FEF, parietal and V4, respectively. For classifier timing (bottom left/right): N=23/22, 5/4, 8/0, and 8/8 for selection/generalization in LPFC, FEF, parietal and V4, respectively Selection Classification Accuracy: FEF p<1e-16, Parietal p<1e-16, V4 p<1e-16. Selection Classification Timing: FEF p<1e-16, Parietal p<1e-16, V4 p<1e-16. Generalization Classification Accuracy: FEF p=0.001, Parietal p=0.021, V4 p=0.002. Generalization Classification Timing: FEF p<1e-16, V4 p<1e-16. (e) To determine if there were sub-populations of selective neurons in a region with greater selectivity than the overall population, we ranked neurons in each region by their ability to support the selection (left) or generalized (right) classifier (see methods). Neurons with firing rates that yielded large magnitude (and sign consistent) d-primes for the cued location (upper or lower) across both of the retro cue sets will support selection classifier performance (left). We quantified this by projecting these two d-prime values onto the identity (red lines) and taking the absolute value of the resulting vector. Neuron 1 is ranked higher than neuron 2 because of its larger magnitude projection onto the identity. A similar procedure can be used to rank neurons for generalization from pro to retro trials (right) by repeating the procedure based on selectivity for ‘pro cueset 1’ and ‘retro cueset 2’. (f) Neuron dropping curves (as in c), except that neurons are added to the analysis based on their selectivity/generalization, as described in d. Shaded region is 95% confidence intervals of best linear fit (which fit better than power functions, see methods). Even when selecting ideal subpopulations from each region, no region significantly exceeds PFC performance. Note that performance now decreases as N increases because, due to our ranking procedure, later cells are by-design less able to support performance on withheld cues (whether within selection or across selection/attention). These later neurons may still be weighted heavily by the classifier (due to good performance on the training set) and so negatively impact performance at test. This is exemplified by the projections onto one axis in (d) (dashed lines), showing a greater weighting for neuron 2, despite it not facilitating generalization. For classifier accuracy (top row): N=35, 10, 19, and 22 unique population sizes for LPFC, FEF, parietal and V4, respectively. For classifier timing (bottom left/right): N=35/35, 10/10, 19/18, and 22/22 for selection/generalization in LPFC, FEF, parietal and V4, respectively. (g) To examine ‘bottom-up’ information flow about low-level sensory aspects of the cue, we trained classifiers to discriminate the variants of each cue, using cross validation across subsets of trials (see methods). (h) Neuron dropping curves (as in c) for these ‘cue appearance’ classifiers. Cue appearance classifiers yielded a qualitatively different pattern of performance, with V4 showing superior classification performance at cue offset (left) and faster classification onset (right). Asterisks indicate significance of projected classification for a given region compared to the measured classification in LPFC at the maximum number of neurons (two-sided z-test, not corrected for multiple comparisons). N=35, 10, 19, and 22 unique population sizes for LPFC, FEF, parietal and V4, respectively. Classification Accuracy: FEF p=.282, Parietal p<1e-16, V4 p<1e-16. Classification Timing: FEF p=0.005, Parietal p=4.24e-16, V4 p=2.27e-8. · p<0.1, * p<0.05, ** p<0.01, *** p<0.001 for all panels.
