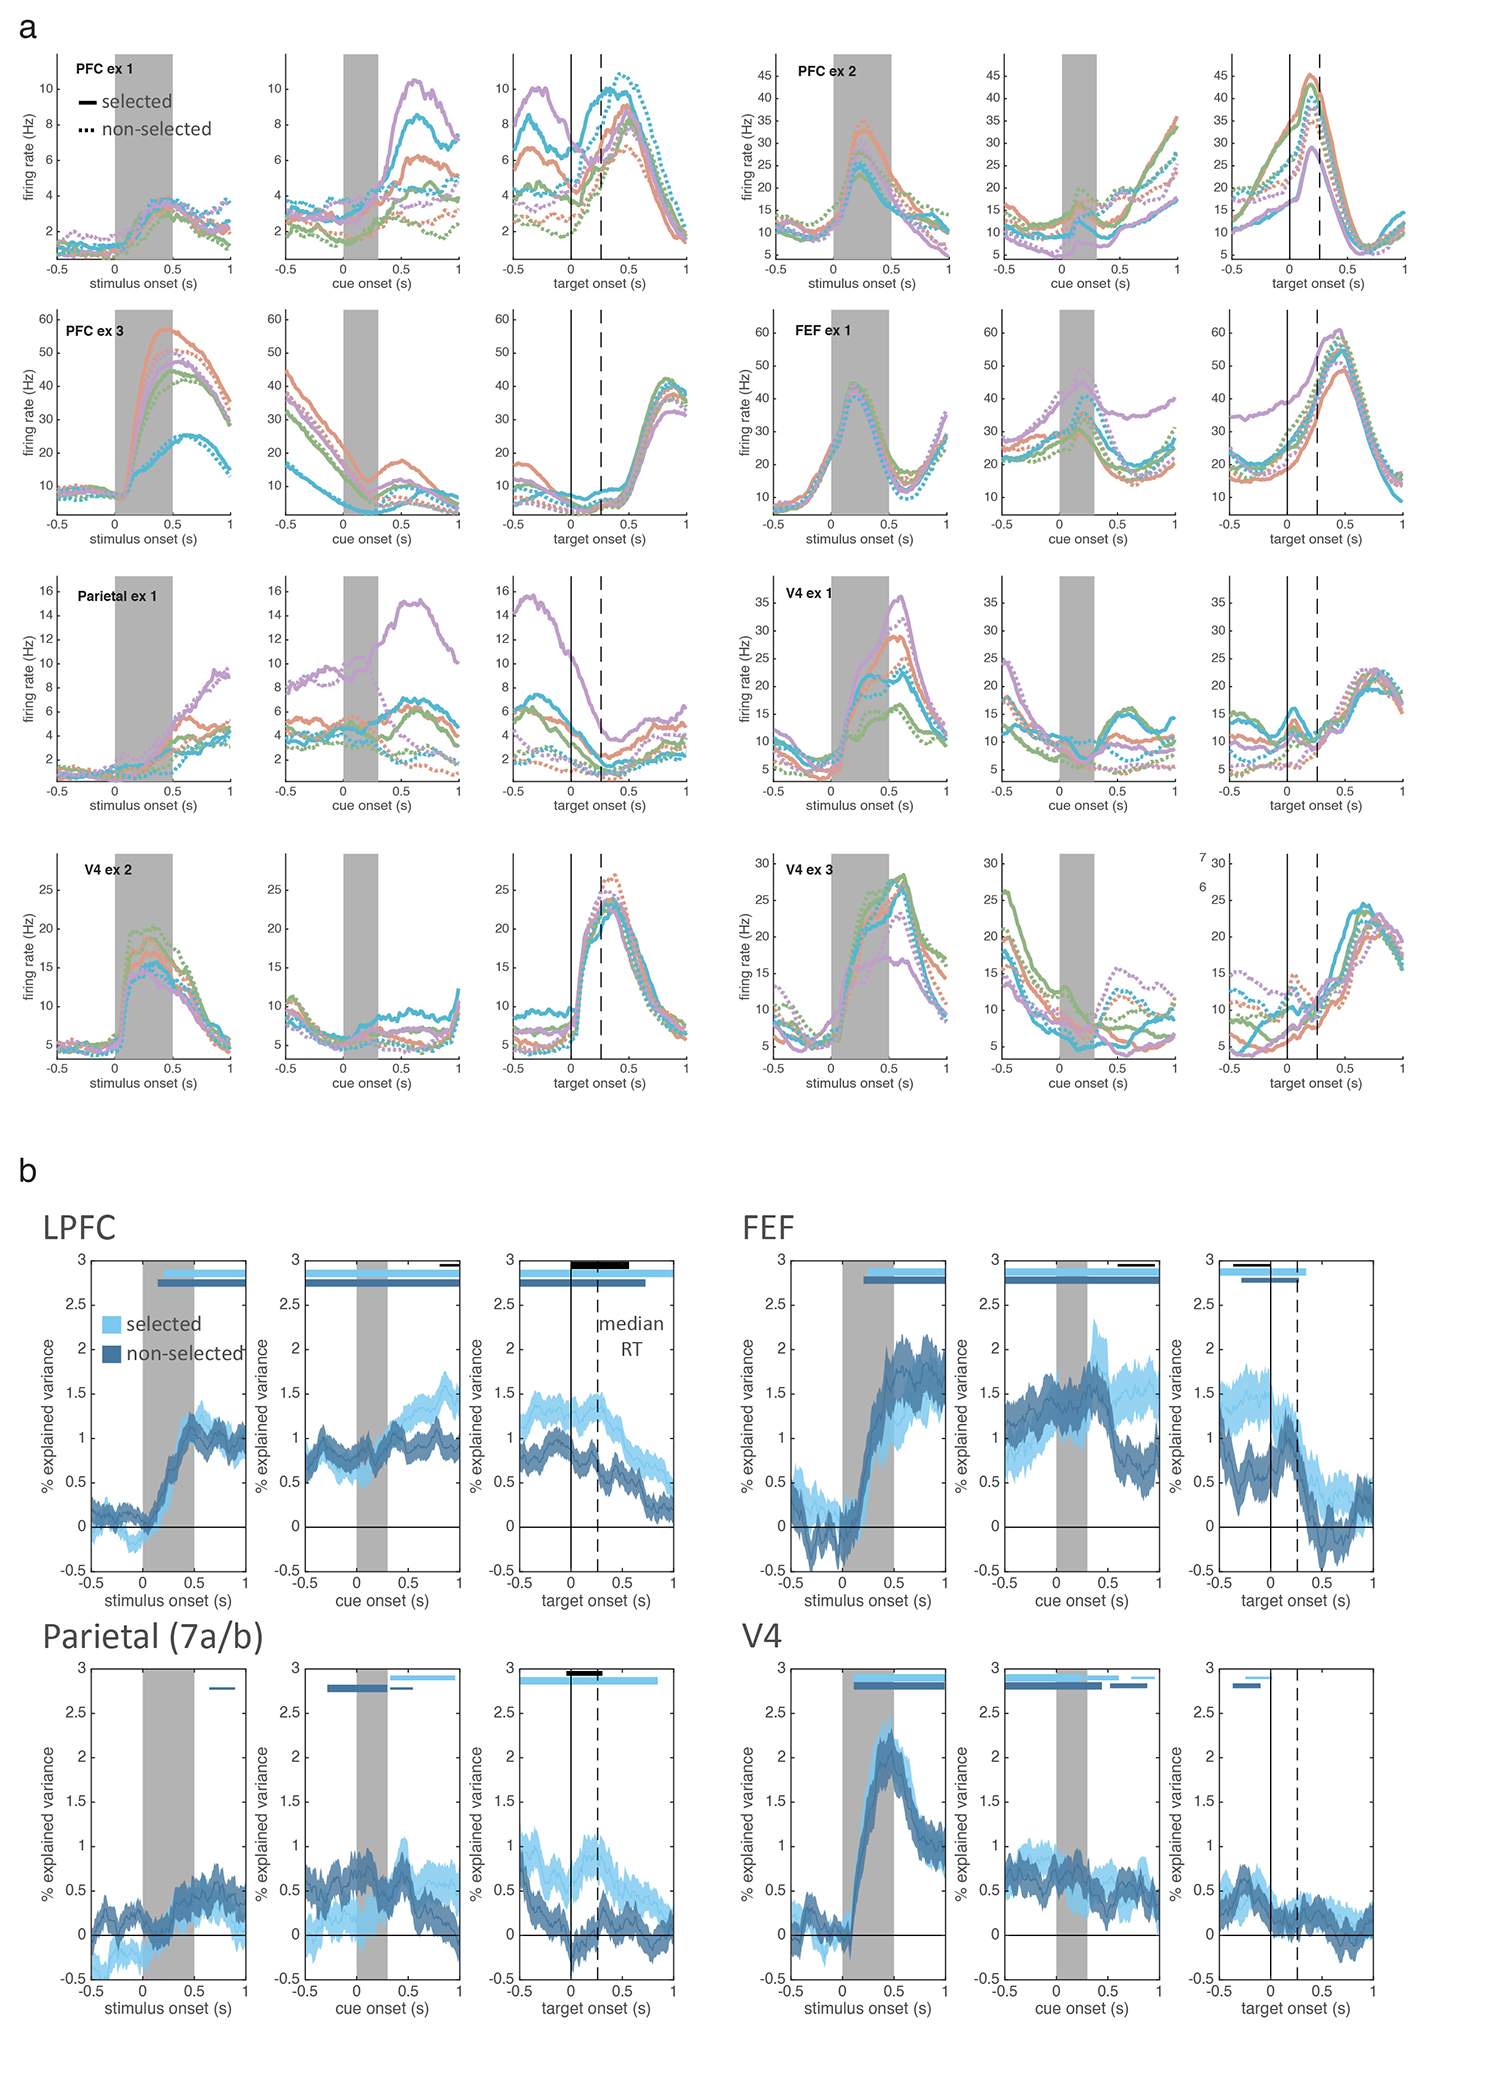
Extended Data Figure 5.

(a) Mean firing rate for example neurons during the retrospective condition, binned by the color (indicated by line color) of the selected (solid) or non-selected (dashed) stimulus. Example neurons are shown for all four brain regions (labeled in upper left). (b) Lines show mean selectivity of neurons in all four regions about the color of the selected and non-selected stimulus (in light and dark blue, respectively) in each brain region, averaged across neurons. Selectivity is measured using a percent explained variance statistics (see methods) and shows similar results as when using a entropy statistic (Figure 3). Shaded regions show STE across neurons (LPFC: 574 neurons, FEF: 163 neurons, Parietal: 292 neurons, V4: 311 neurons). Horizontal bars indicate significant information for the selected item (light blue), the non-selected item (dark blue), and a significant difference in information about the selected and non-selected items (black). Bar width indicates significance: p<0.05, 0.01, and 0.001 for thin, medium, and thick, respectively (two-sided cluster-corrected t-tests).
