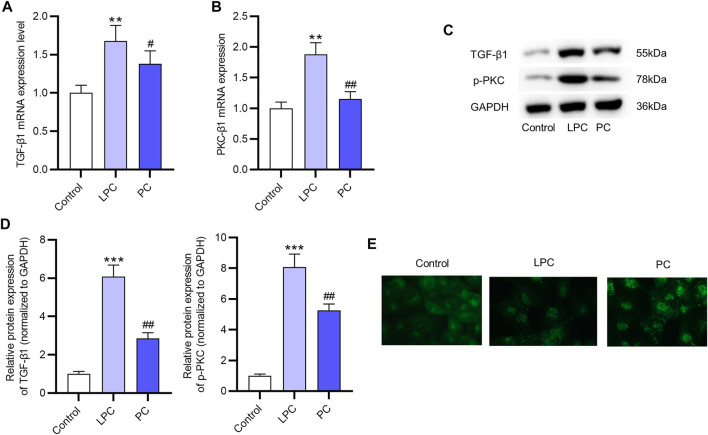
FIGURE 5.
The promotive effect of LPC on the activation of the PKC signaling in EPCs. (A,B) The mRNA expression of PKC-β1 and TGF- β1 after LPC or PC treatment in EPCs were measured by RT-qPCR. (C,D) The protein levels of p-PKC and TGF-β1 were in EPCs treated with LPC or PC were accessed using western blot. (E) Immunofluorescence staining was used to determine the location of PKC-β1 after the LPC or PC treatment in EPCs (Figure 5D). **p < 0.01, ***p < 0.001 compared with the control, # p < 0.05, ## p < 0.01 compared with the LPC group.

