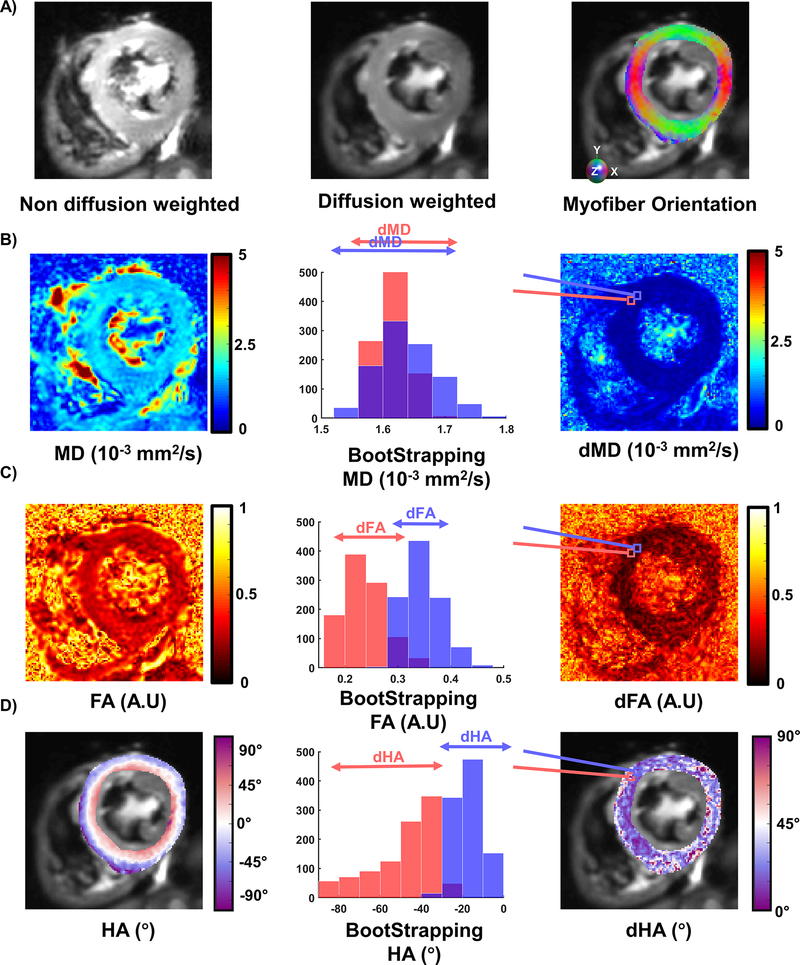
Figure 7:
Example of DTI metrics and uncertainty estimation. A) Non-diffusion weighted, diffusion weighted and myofiber orientation colored maps. B) Mean diffusivity (MD) maps, two bootstrapped distributions displayed for two adjacent pixels exhibiting extreme differences. The 95% confidence interval of these distributions correspond to the uncertainty MD (dMD) maps displayed on the right. C) Fraction of anisotropy maps, bootstrapped distribution for two voxels, and corresponding dFA maps. D) Helix Angle (HA) maps, bootstrapped example and dHA maps.

