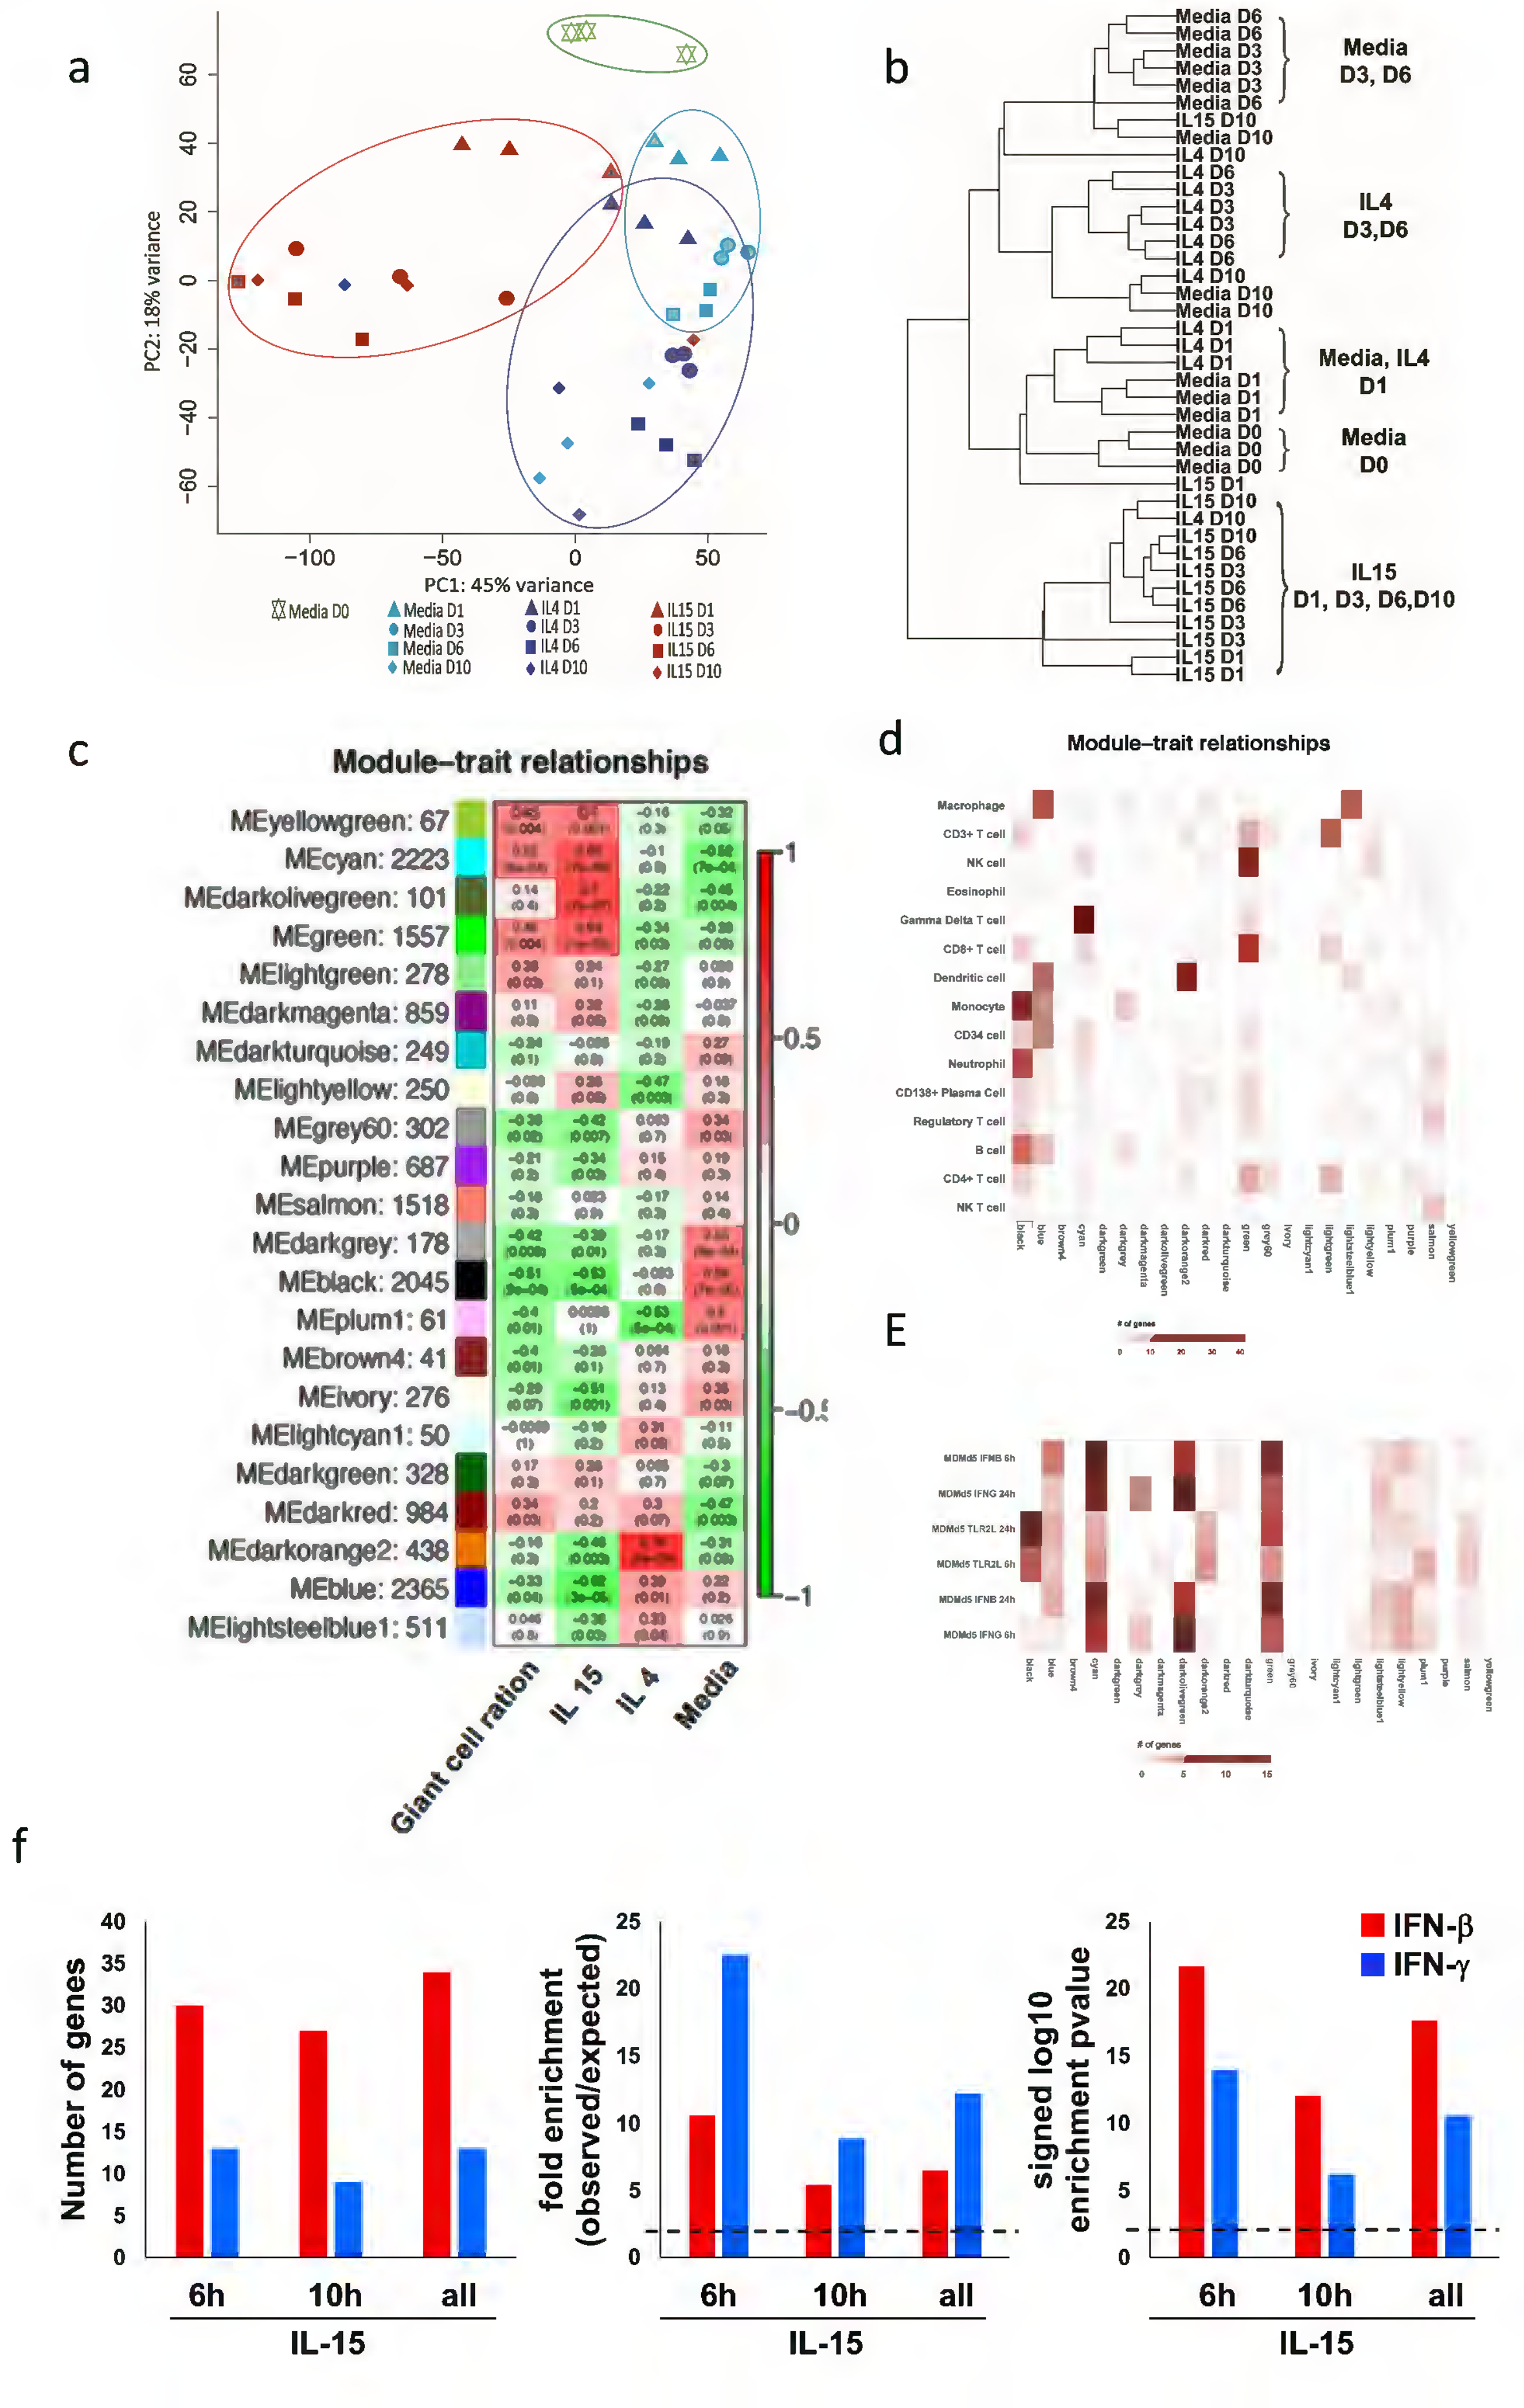
Figure 3.

Gene expression analysis of LGC formation. (a) Principal component analysis (PCA) of the DESeq2 normalized counts was used to displaying similar trends in gene expression. (b) Hierarchical clustering for the characteristics of the relationships amongst samples. (c) Identification of LCG gene modules. WGCNA eigengene modules correlated to at least one condition (p ≤ 0.05). Red indicates positive correlation, and green indicates inverse correlation. Module eigengenes, as well as the corresponding number of genes in each module, are labeled on the y axis, and conditions are labeled on the x axis. (d) Integration of WGCNA gene modules with cell-type–specific gene signatures. For each of the modules of related genes derived from WGCNA analysis, enrichment for cell-type–specific gene signatures for cell types with immune or structural functions were calculated and displayed in a heatmap of Z scores. Cell-type names are provided in rows, and WGCNA module are provided in the column. (e) Integration of WGCNA for interferon signature. For the significant modules derived from WGCNA, enrichment for MDM IFN-γ and IFNβ specific downstream genes (2h, 6h and 24h) were calculated and displayed in a heatmap of Z scores. (f) Enrichment analysis of overlap between IFN-γ and IFN-β- specific upregulated genes identified in IL-15 treated- human monocytes time points transcripts (fold change ≥ 2 and P ≤ 0.05). Dotted lines indicate either the expected fold enrichment of one (left) or the hypergeometric enrichment P value of 0.05 (log P = 1.3, right). Hypergeometric analyses were performed to determine fold enrichment (observed/expected) and signed log enrichment P value (negative for deenriched). The Bonferroni multiple hypothesis test correction was applied for each group.
