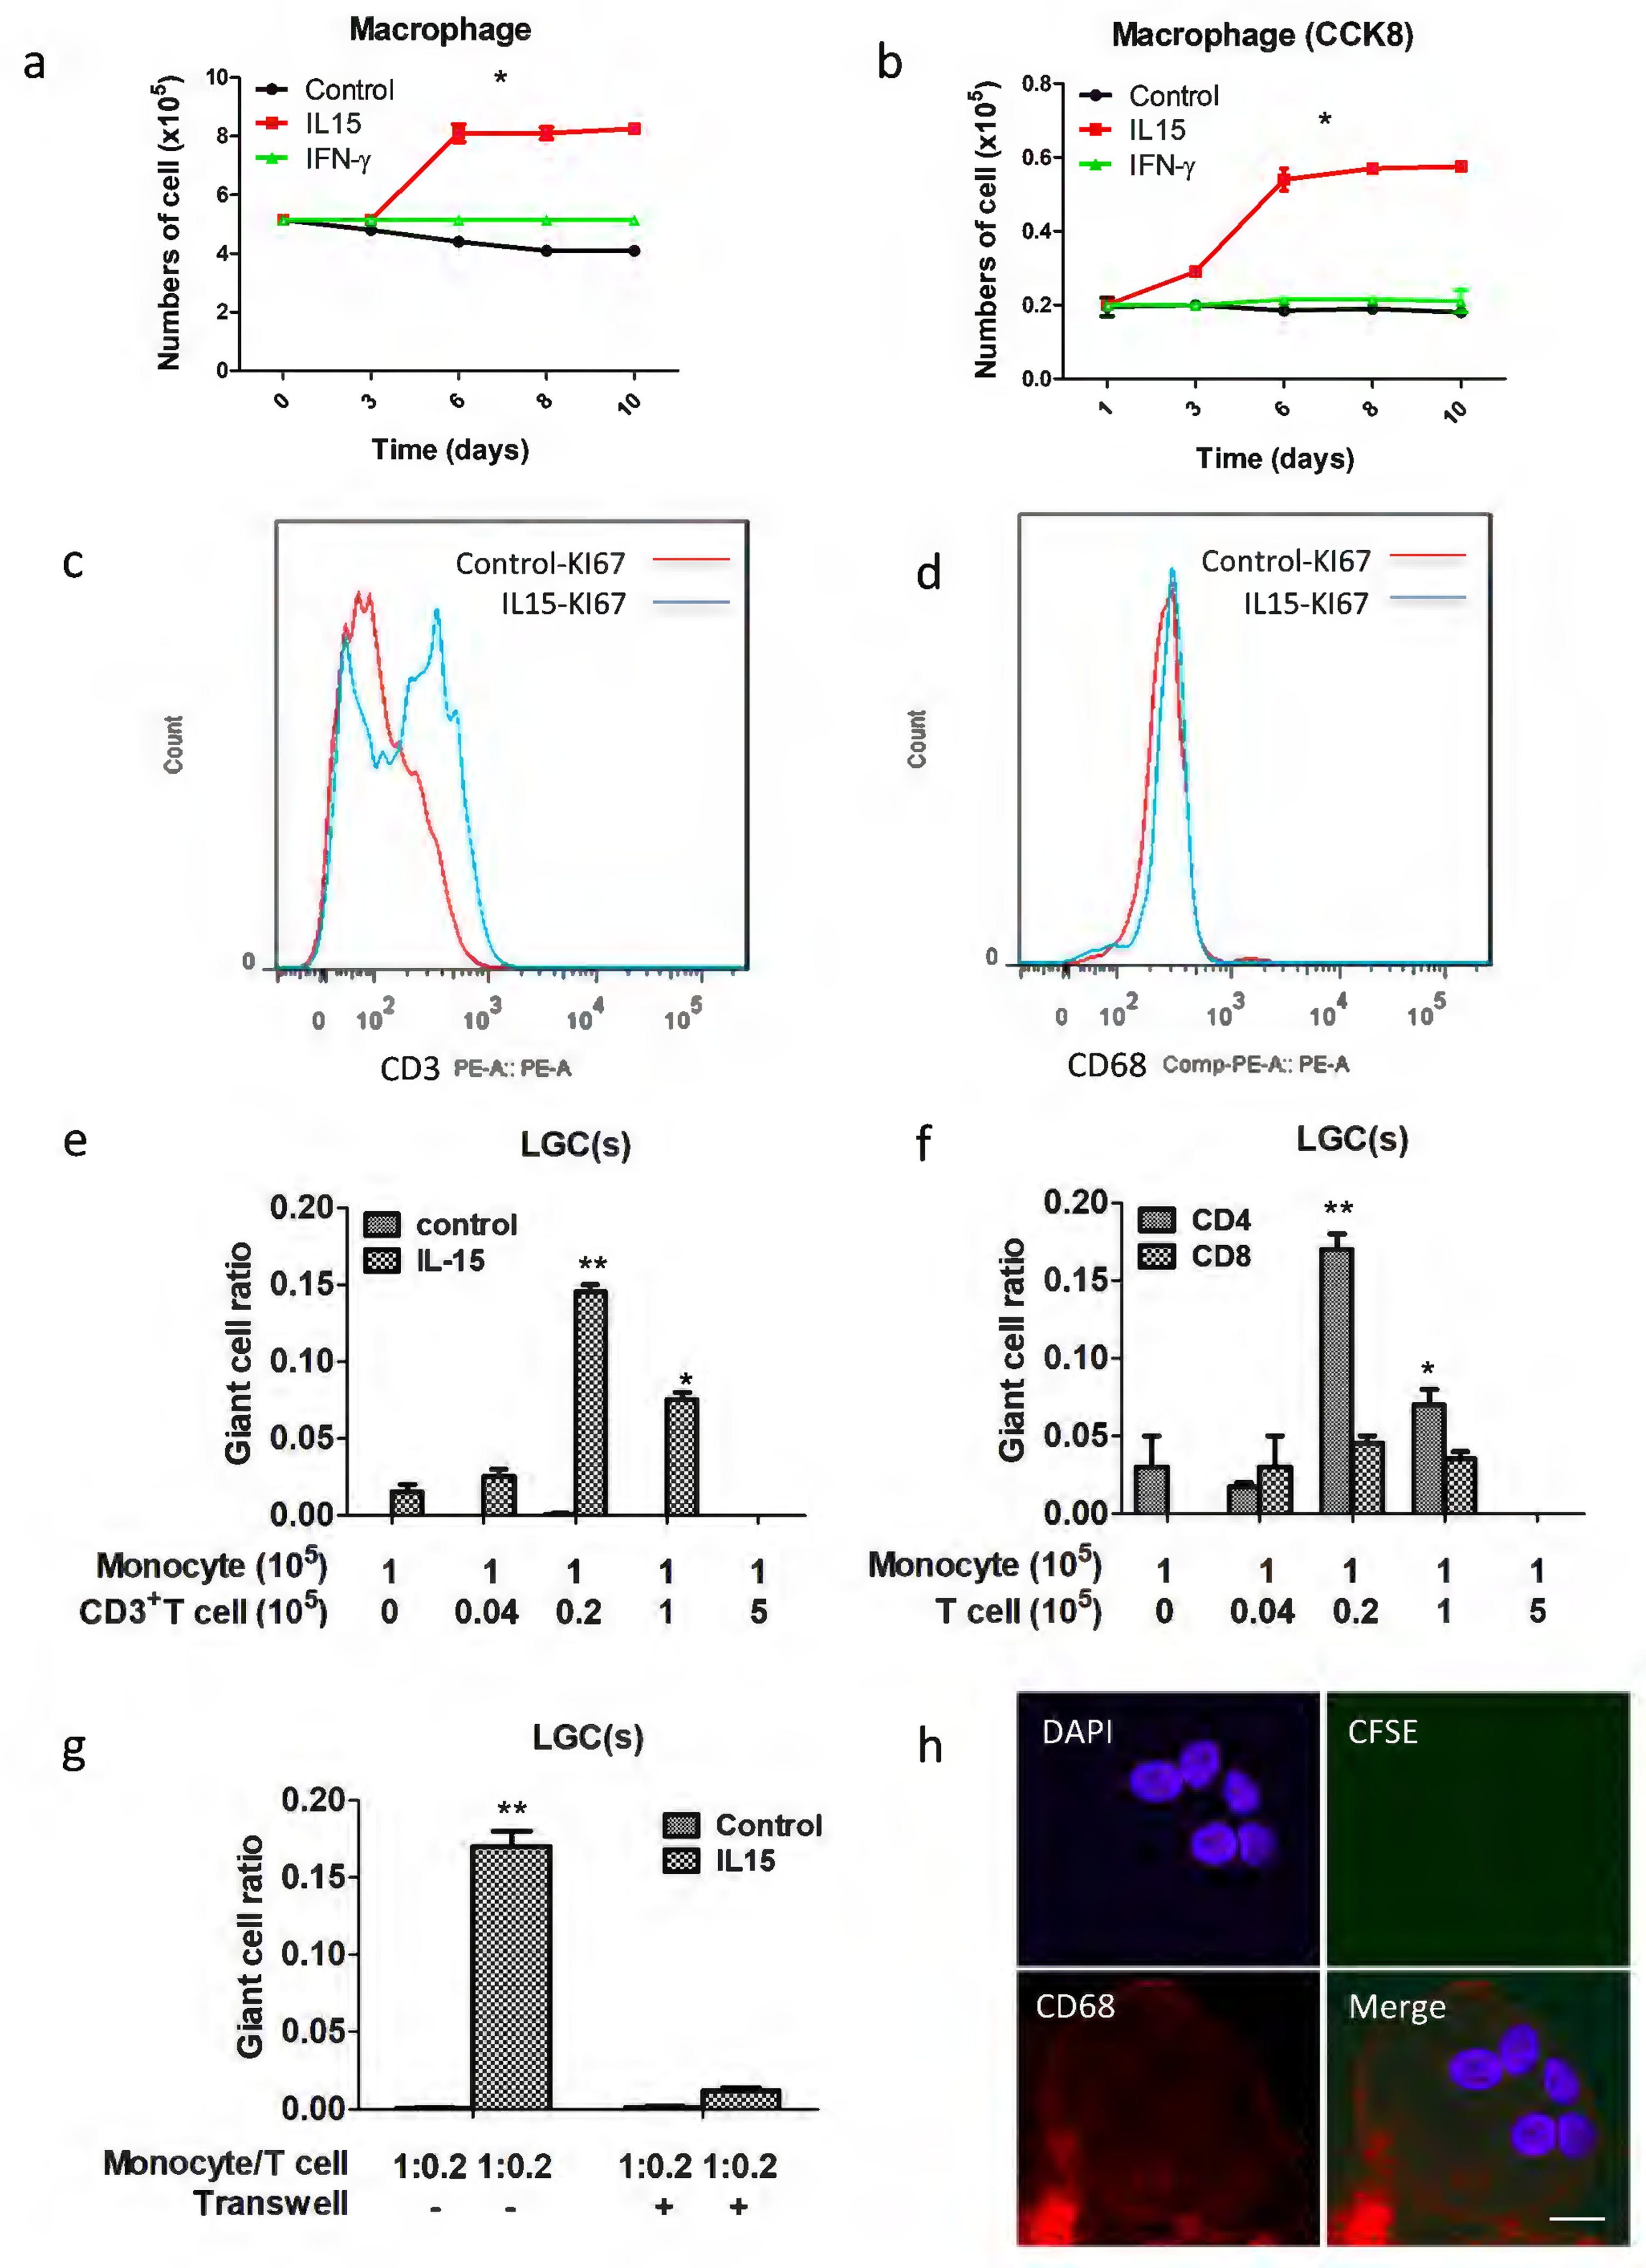
Figure 5.

T cell proliferation analysis and human monocytes (CD14+ cells isolated from PBMCs after depletion of T cells using anti-CD14 microbeads) cultured with autologous T cells induces LGC formation. Cells were counted (a), CCK8 added (b) and stained by KI67 with CD68 (c) and CD3 (d) to detect proliferation from 1 day to 10 days. (e) the mean total number of LGCs by the different ratio between monocytes and T cells. (f) CD4+ T cells induced LGCs more efficiently than CD8+ T cells. ‘Monocyte’ refers to the number of monocytes x 105, and “T cell” refers to the number of T cells x 105. (g) Transwell analyses the relationship between monocyte with autologous T cells for LGC formation. (h) Pre-stain T cells with CFSE, and then cultured with monocytes, laser scanning confocal microscopy analysis the LGCs formation at 10 days with CD86-APC (red), CFSE (green) and DAPI (blue), scale bar: 10μm. Values represent the mean giant cell ratio calculated without distinguishing between monocytes and T cells, and error bars indicate the standard mean of the error of the indicated ratio of monocytes to T cells.
