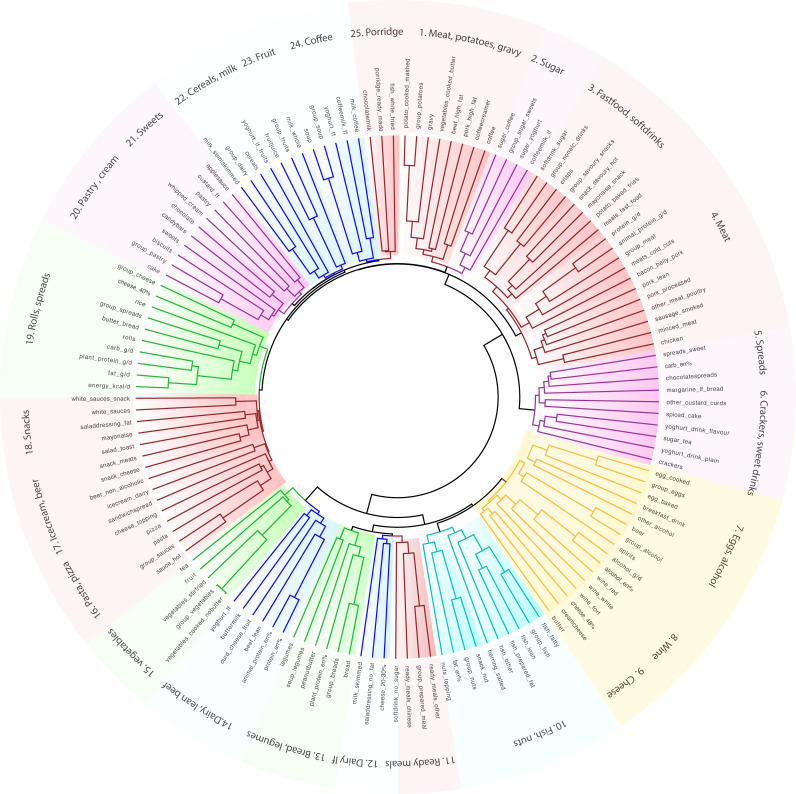
Figure 1.
Unsupervised dietary cluster analysis reveals common food patterns. Cladogram showing clustering of the dietary intake into 25 patterns. Food frequency questionnaires were used to assess the diet of 1425 individuals comprising healthy controls (n=871), individuals with irritable bowel syndrome (n=223), Crohn’s disease (n=205) and ulcerative colitis (n=126). Unsupervised hierarchical clustering was performed using squared Euclidean distances.

