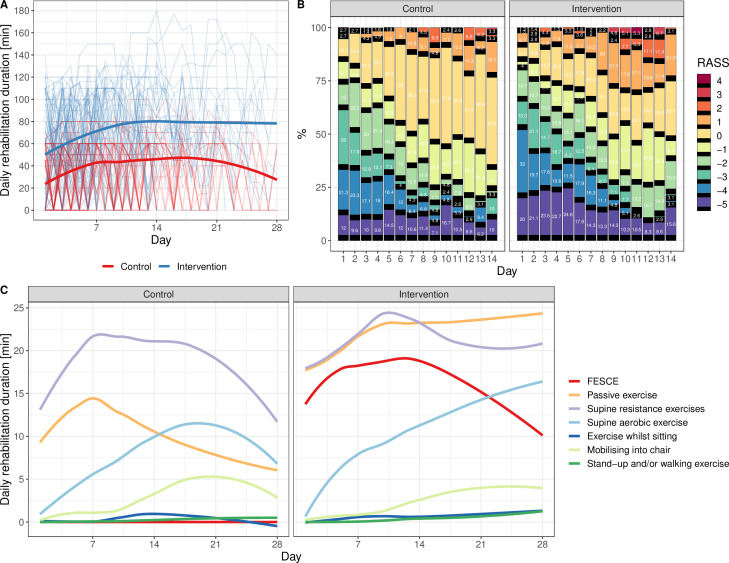
Figure 2.
Protocol implementation indices. (A) Average duration of rehabilitation in intervention (blue line) and control (red line) groups in all days of all patients (ie, including days without rehabilitation). Thin lines are individual patients (one outlier received up to 180 min of rehabilitation a day due to protocol violation). (B) Sedation level heatmap. (C) Average types of exercise delivered daily. FESCE, functional electrical stimulation-assisted cycle ergometry; RASS, Richmond Agitation-Sedation Scale, where 0 (alert and calm) or −1 (drowsy) were target levels of sedation management.

