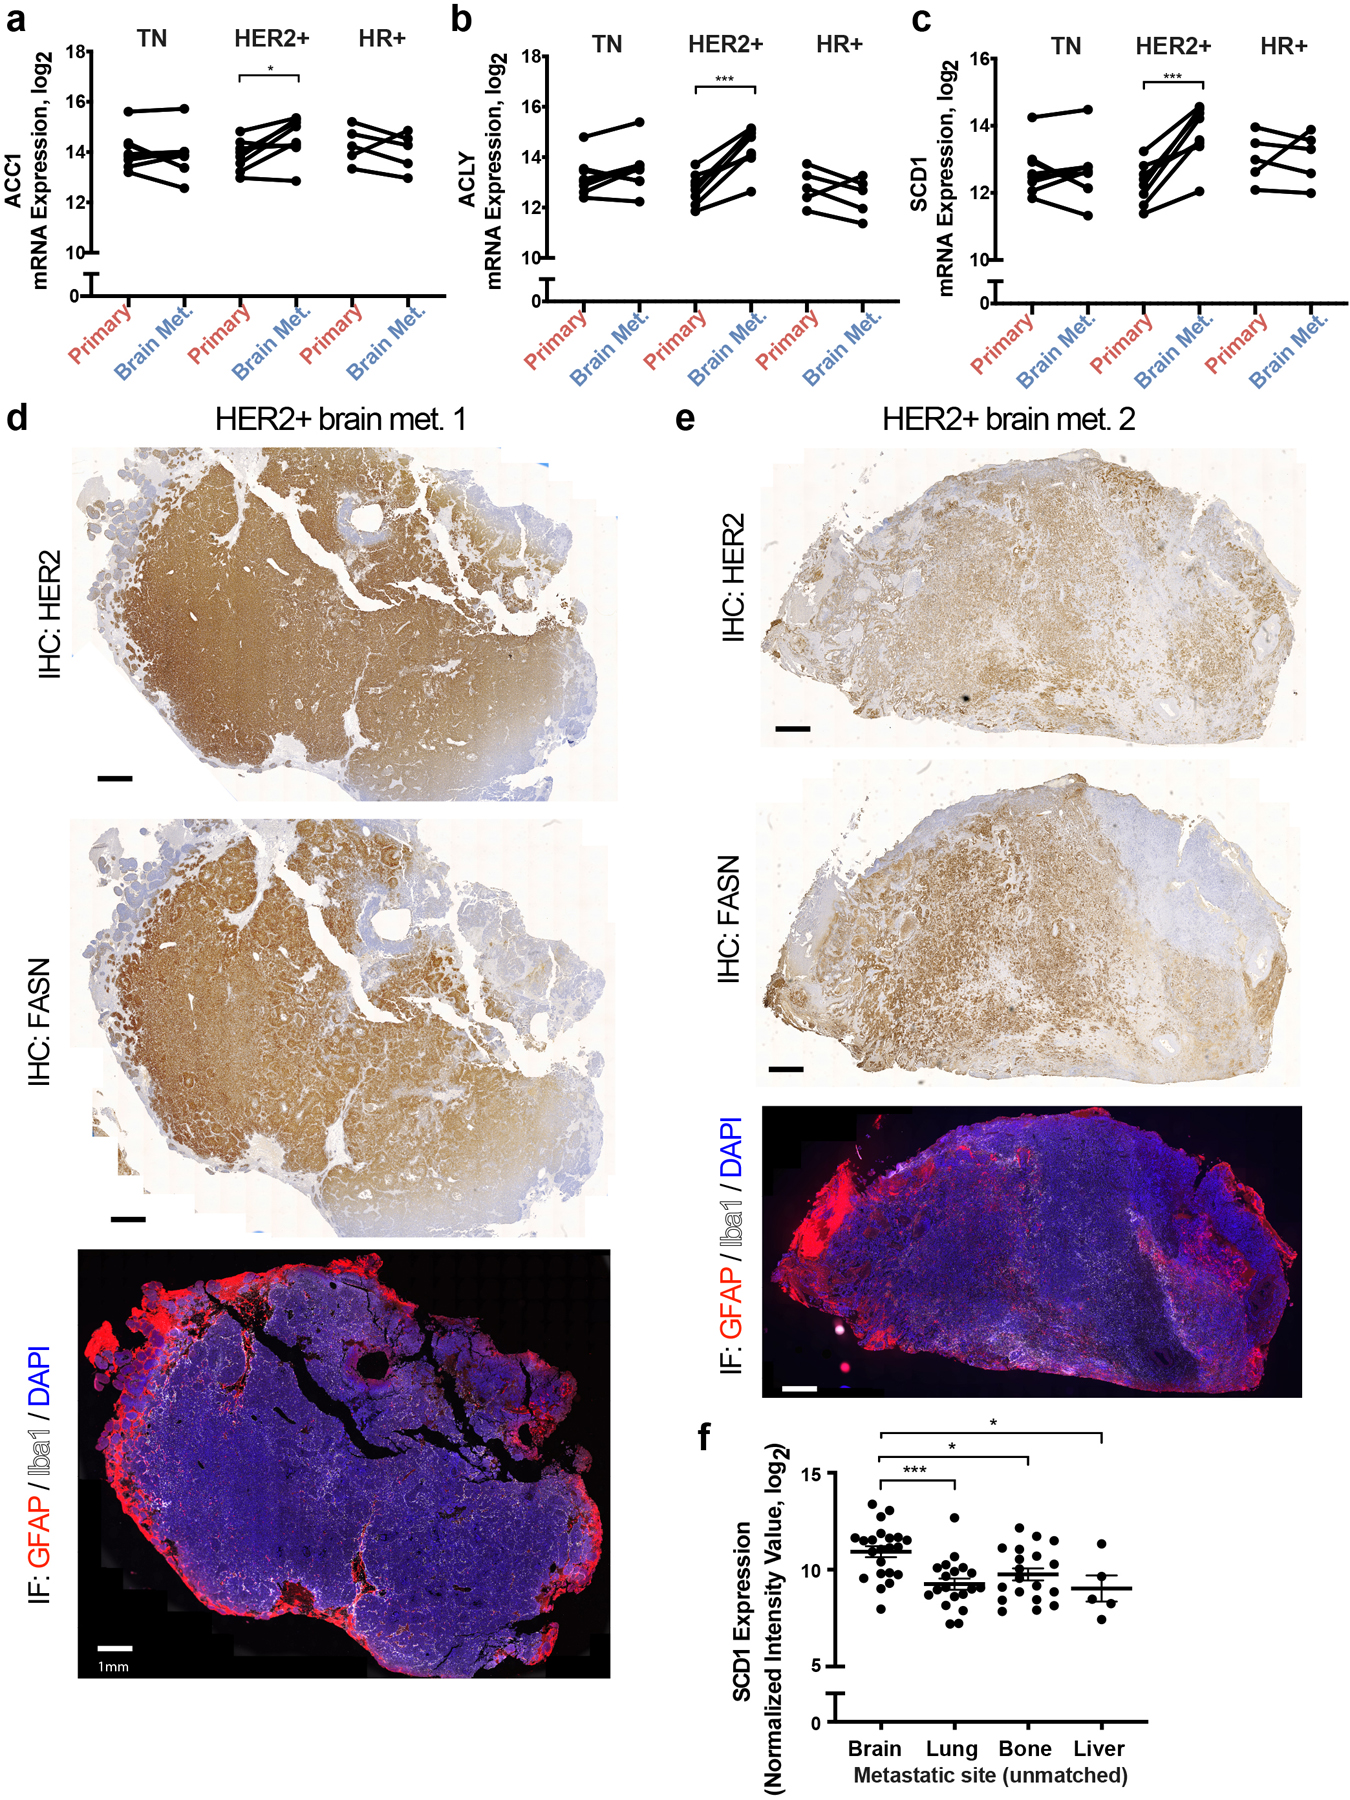
Extended Data Fig. 4. FASN expression is high in breast cancer brain metastases.

a-c) ACC1, ACLY and SCD1 mRNA expression levels from a patient-matched metastatic breast cancer RNAseq dataset30. Matched primary versus brain metastasis (Brain Met.) samples were analyzed separately for the major clinical molecular subtypes. * p = 0.0254 (a), *** = 0.0003 (b), **** p = 0.0005 (c), by two-tailed paired sample t-test. (Triple negative (TN) tumors, n=8; Human epidermal growth factor receptor 2+ (HER2+) tumors, n=8; Hormone receptor + (HR+) tumors, n=5).
d-e) Immunohistochemistry (IHC) and immunofluorescence (IF) assessment of brain metastasis tissue sections derived from 2 different patients with HER2+ breast cancer. IHC was performed to assess HER2 and FASN expression, and IF together with DAPI staining was used to assess glial fibrillary acidic protein (GFAP) and ionized calcium binding adaptor molecule 1 (Iba1) expression on consecutive tissue sections. (scale bar = 1mm).
f) Analysis of SCD1 mRNA expression from a metastatic breast cancer gene expression database comprised of unmatched human tumor samples32,33. Data presented represent mean expression ± SEM. * p = 0.0212 (Brain vs Bone), * p = 0.0172 (Brain vs Liver), *** p = 0.0006 by one-way ANOVA followed by Dunnettś multiple comparisons test (Brain tumors, n=22; Lung tumors, n=20; Bone tumors, n=18; Liver tumors, n=5).
