
Extended Data Fig. 5. Impact of extracellular lipids on lipid synthesis enzyme expression and lipid abundance.
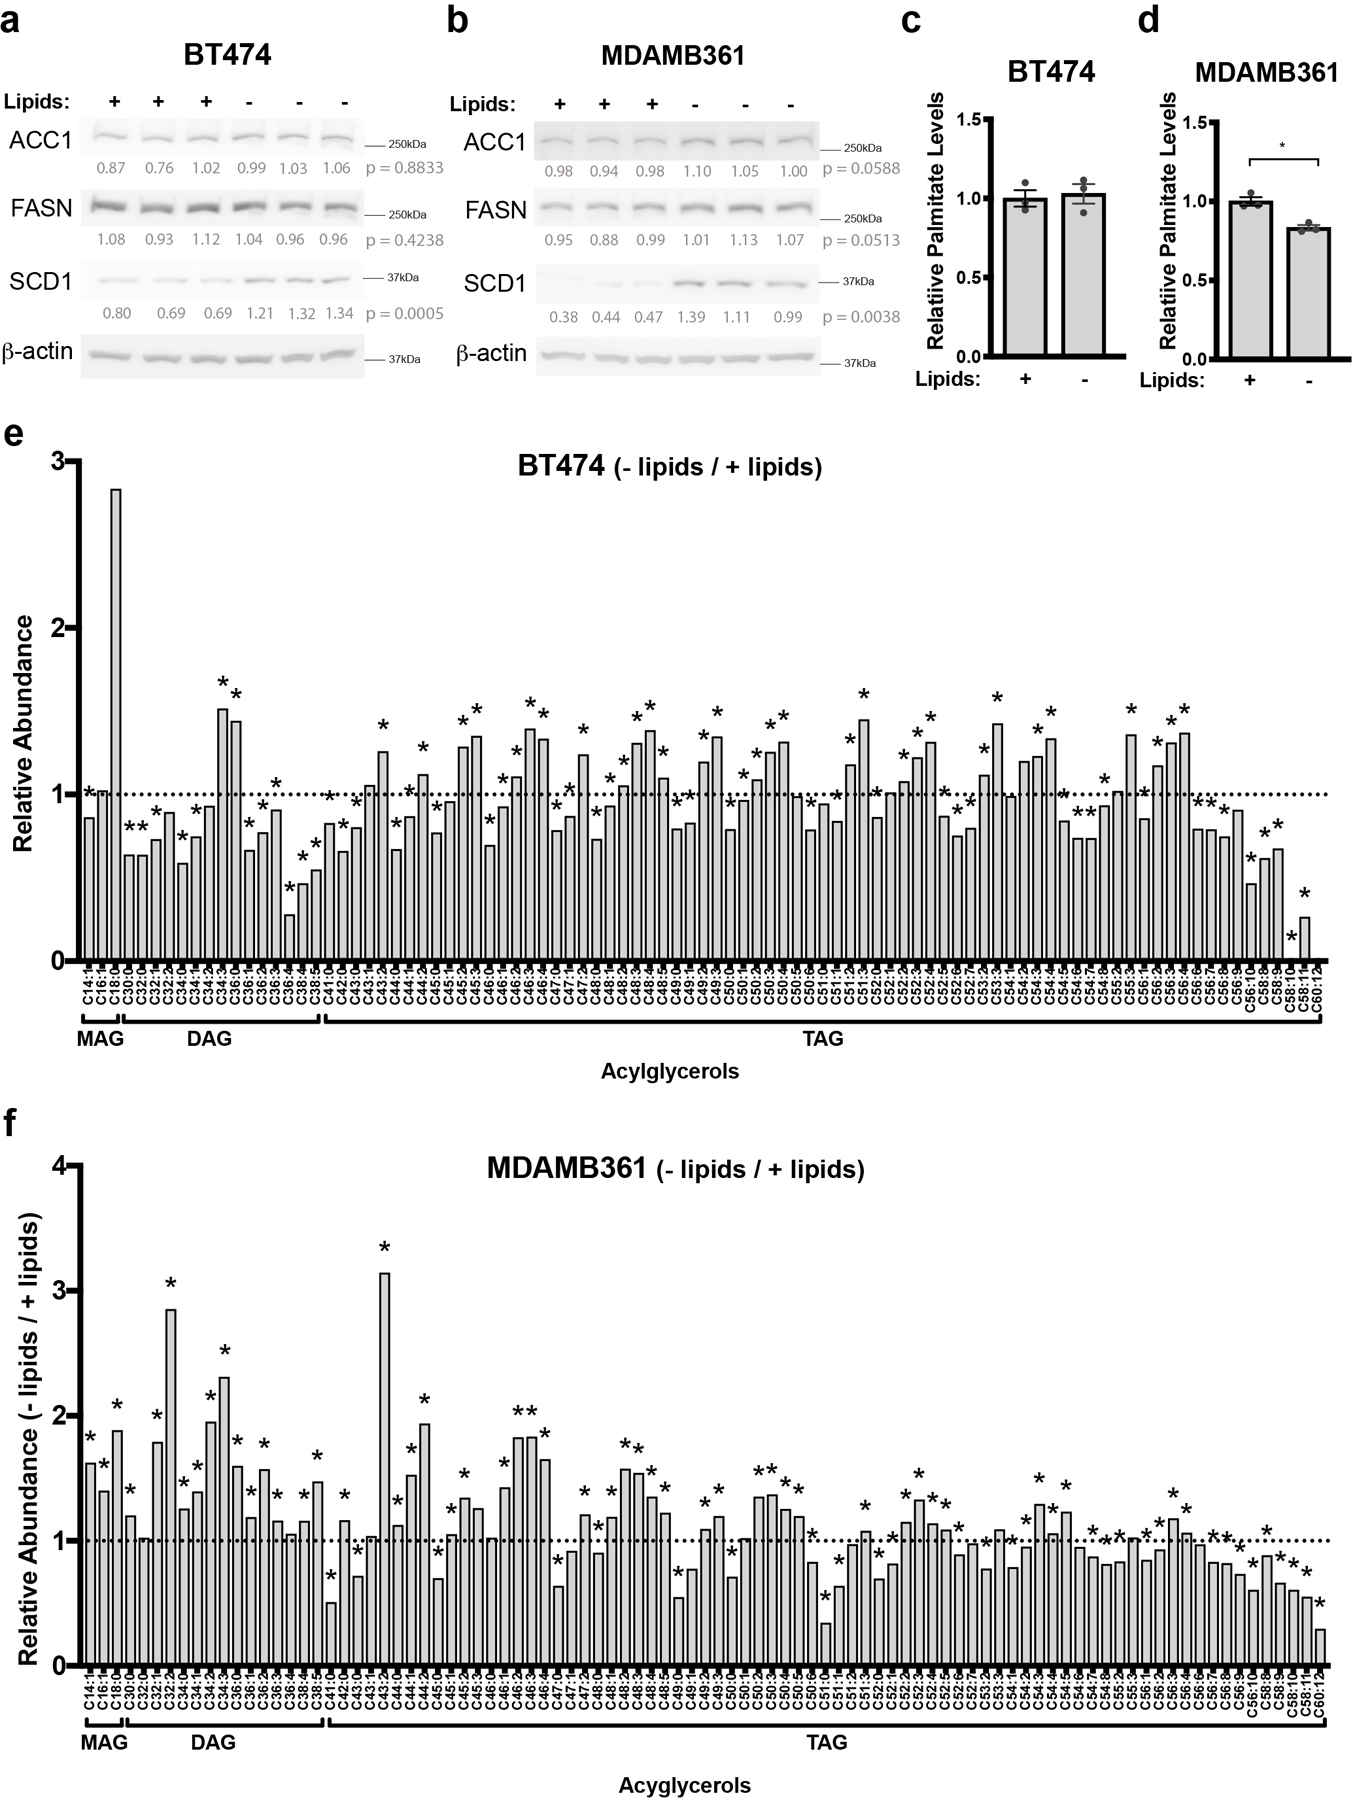
a, b) Western blot analysis of FASN, ACC1 and SCD1 in BT474 (a) and MDAMB361 cells (b) cultured in standard (+Lipids) or delipidated (-Lipids) media for 6 days. Lysates were generated from 3 independent samples. β-actin expression was assessed as a loading control. Relative densitometry values (normalized to β-actin expression) were used for quantitation and are presented below each blot. Differences in expression between conditions were compared by a two-tailed t-test.
c, d) Relative levels of saponified palmitate measured by GCMS in BT474 (c) and MDAMB361 (d) cells that were cultured in standard (+Lipids) or delipidated (-Lipids) media for 72 hours. The samples analyzed are the same as those presented in Figure 5c. Palmitate levels are normalized to the standard media condition * p = 0.0307 by two-tailed t-test. The data shown represent means ± SEM (n=3 cell culture biological replicates).
e, f) Ratio of complex lipid levels measured by LCMS of BT474 (e) and MDAMB361 (f) cells cultured in standard (+Lipids) or delipidated (-Lipids) media for 6 days. Lipid levels were normalized to protein content as quantified by sulforhodamine b and are presented as a ratio (−/+ Lipids) to show how levels differ based on media lipid availability. A black dotted line indicates a ratio of 1, representing no difference in lipid levels between − Lipids and + Lipids culture conditions. * q < 0.1 by Multiple t-test, False Discovery Rate corrected (n=3 cell culture biological replicates).