
Extended Data Fig. 8. FASN knockdown alters cell lipid composition.
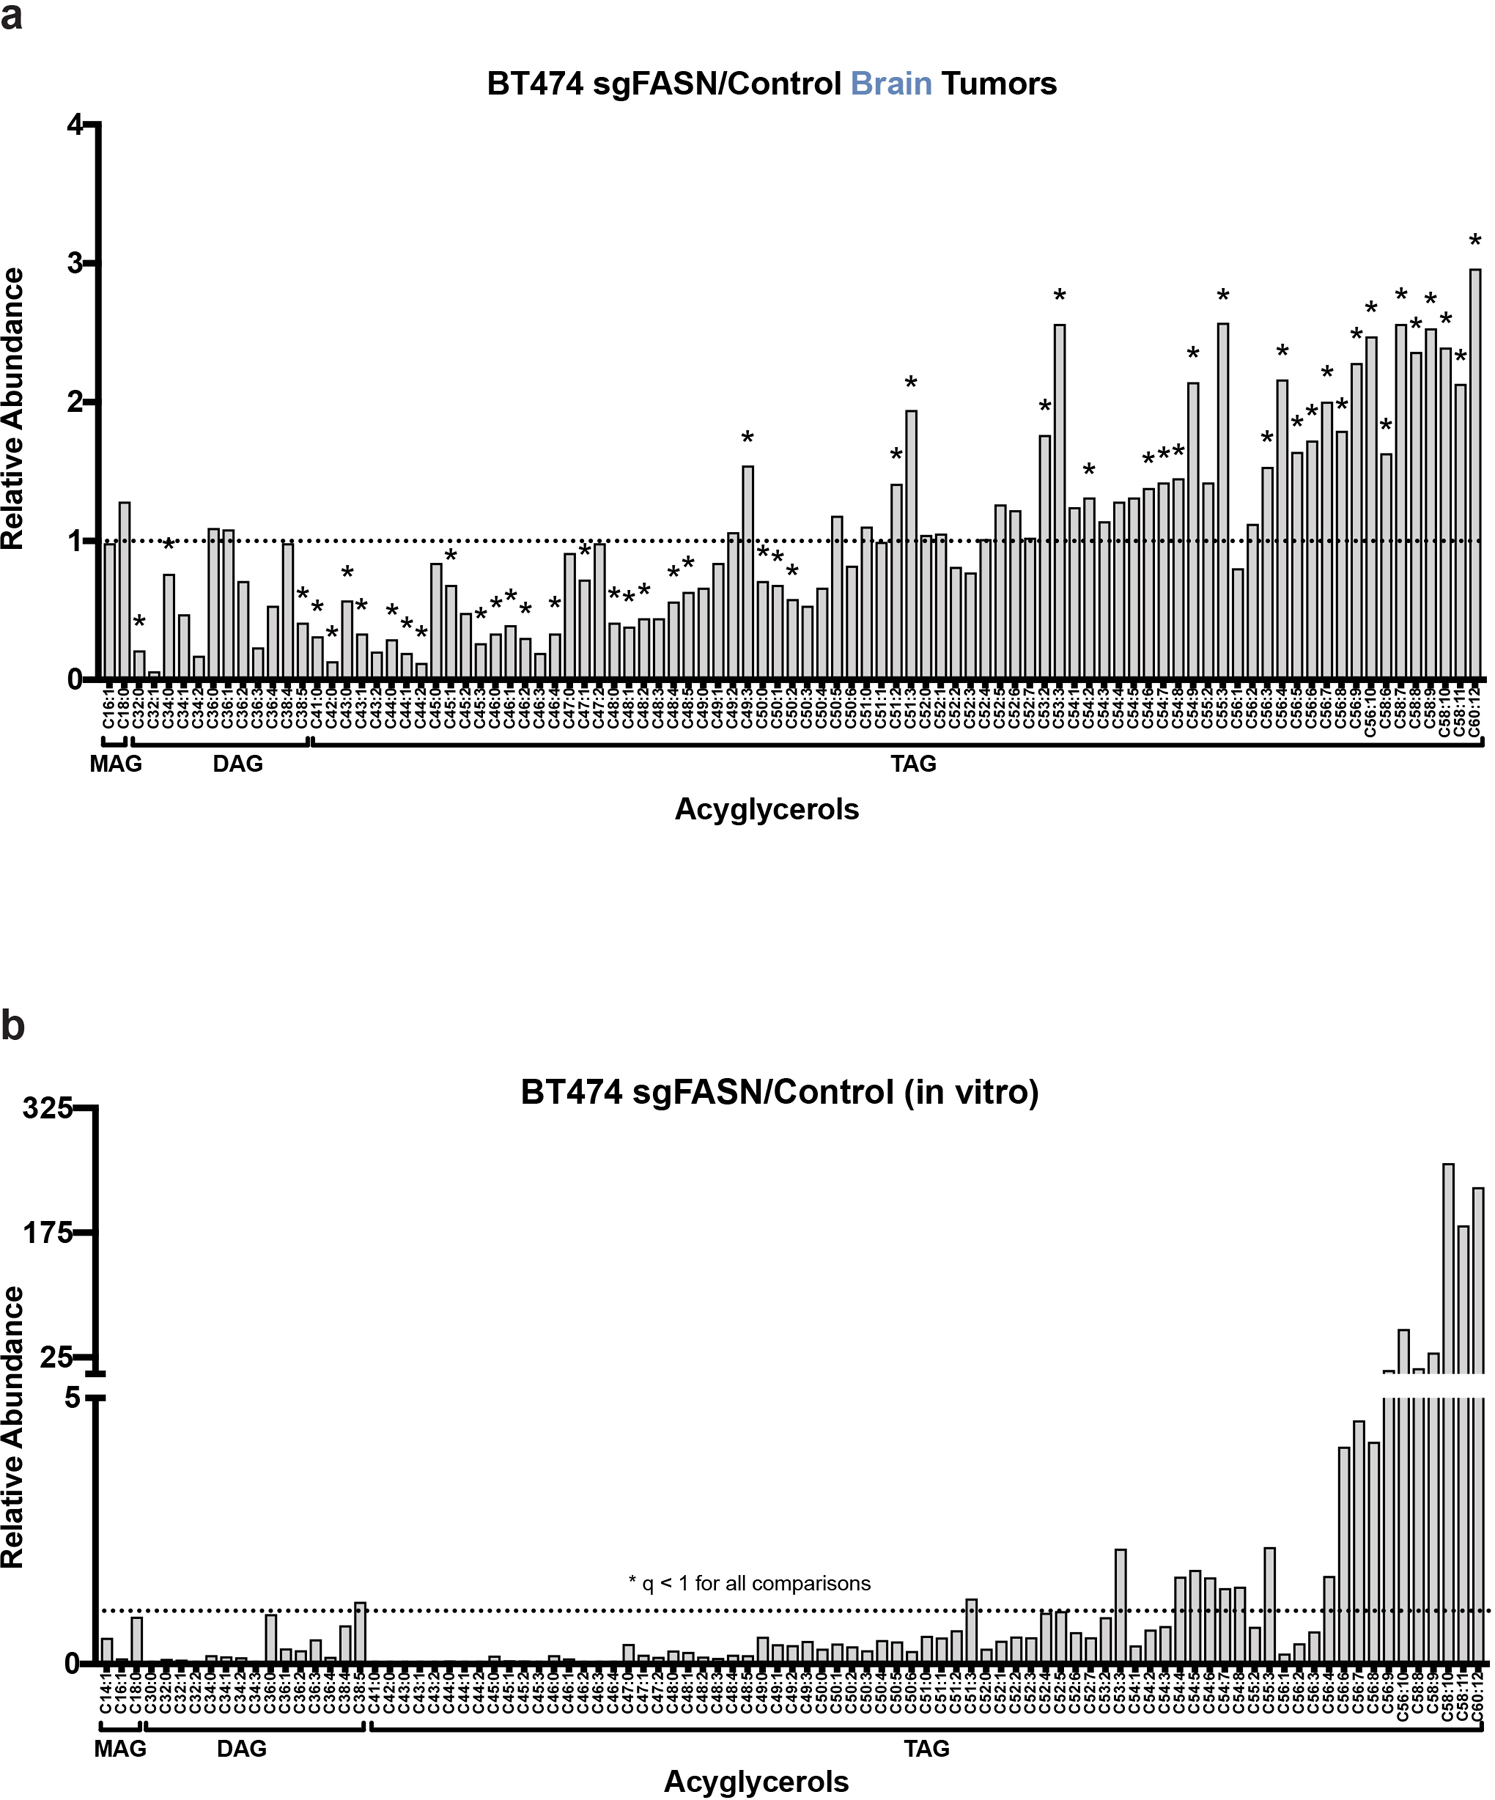
a) The indicated acylglycerol levels measured by LCMS from control and FASN-disrupted (sgFASN_1) BT474 tumors growing in the brain of NSG mice are presented as a ratio to show how levels differ based on FASN expression. A black dotted line indicates a ratio of 1, representing no difference in lipid levels between sgFASN_1 and control BT474 tumor tissue. * q < 0.1 by Multiple t-test, False Discovery Rate corrected (n=4 brain tumors).
b) Complex lipid levels measured by LCMS from control and FASN-disrupted (sgFASN_1) BT474 cells in culture (+Lipids) are presented as a ratio to show how levels differ based on FASN expression. A black dotted line indicates a ratio of 1, representing no difference in lipid levels between sgFASN_1 and control cells. Lipid levels were normalized to protein content as determined by sulforhodamine B. All comparisons are significant, q < 0.1 by Multiple t-test, False Discovery Rate corrected. (n=3 cell culture biological replicates).