Figure 2.
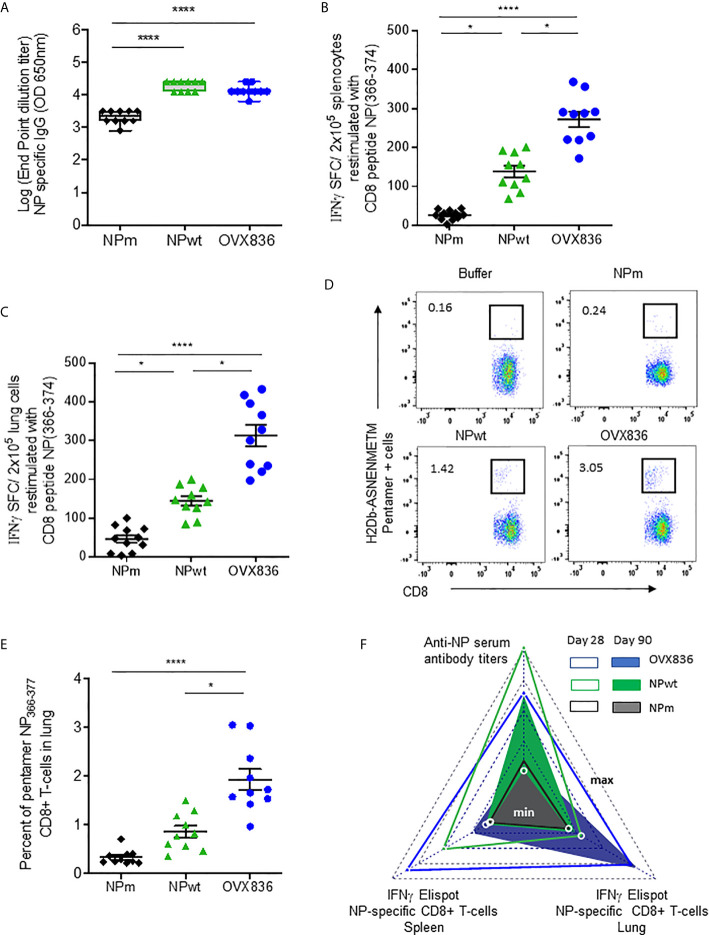
OVX836 vaccine induces higher numbers of persistent NP-specific CD8+ T-cells in lung tissue and spleen compared to NPm and NPwt. C57BL/6 female mice (n = 10) were immunized twice (D0, D21) with 30 µg of NPm, NPwt, and OVX836 by the IM route. (A) NP-specific IgG were measured by ELISA in serum at D28. Levels of IgG are expressed as Log (endpoint dilution titer) and represented in box-and-whisker plots. (B, C) NP366–374-specific IFNγ secreting T-cells (spot-forming cells (SFC)/2 × 105 cells) were measured by ELISpot in the spleen (B) and in the lung (C) at D28. (D, E) In the lung tissue, NP366–374-specific CD8+ T-cells were detected by flow cytometry using pentamer staining (H2Db-NP366–374). Representative flow cytometry plots show frequencies of NP366–374-specific CD3+CD8+ T-cells in the lung (D). Percentage of NP366–374-specific CD3+CD8+ T-cells in the lungs of mice (E). Individual data, mean (line), and SEM are represented, n = 10 mice per group in two independent experiments. Differences were assessed by one-way ANOVA followed by Tukey’s multiple comparison test or with a Kruskal–Wallis test followed by Dunn’s multiple comparison test. *p < 0.05; **** for p < 0.0001. (F) Radar chart presents the minimum (min) and maximum (max) values for each assay as indicated in log10 scale. Comparing the mean of antigen-specific immune responses at D28 (empty triangle) and D90 (plain triangle): NPm (black), NPwt (green), and OVX836 (blue).

