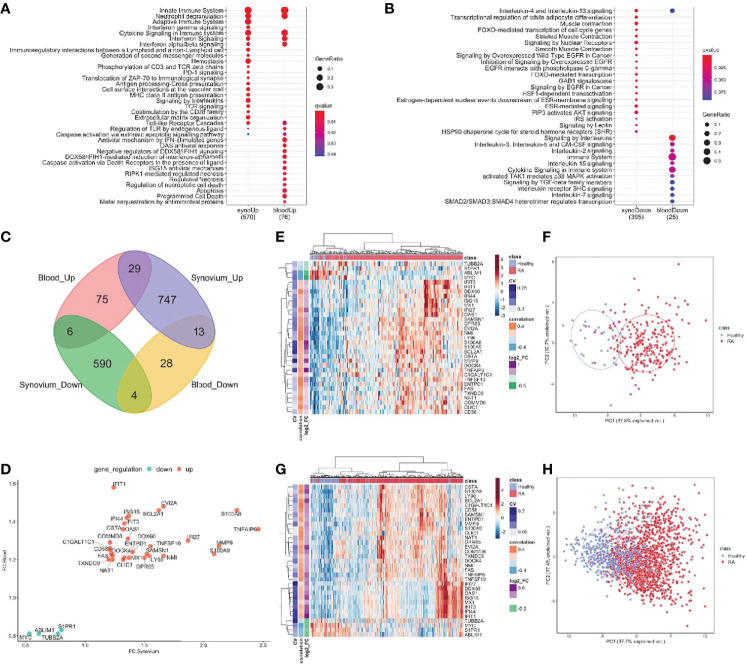
Figure 2.
DE genes overlapped between synovium and whole blood tissues. Top Reactome common and different pathways for (A) Up-regulated and (B) downregulated genes. (C) Venn diagram of up- and down-regulated genes in synovium and blood: 29 common up-regulated genes (p =3e-09) and 4 common downregulated genes (p = 0.28). (D) Comparison scatter plot of fold changes between common genes in synovium and blood. Heatmap and PCA plots of common genes in (E, F) synovium and (G, H) blood. Vertical bars in the heatmap plots represent the color-coded coefficients of variation, Pearson correlations and log2 fold changes.

