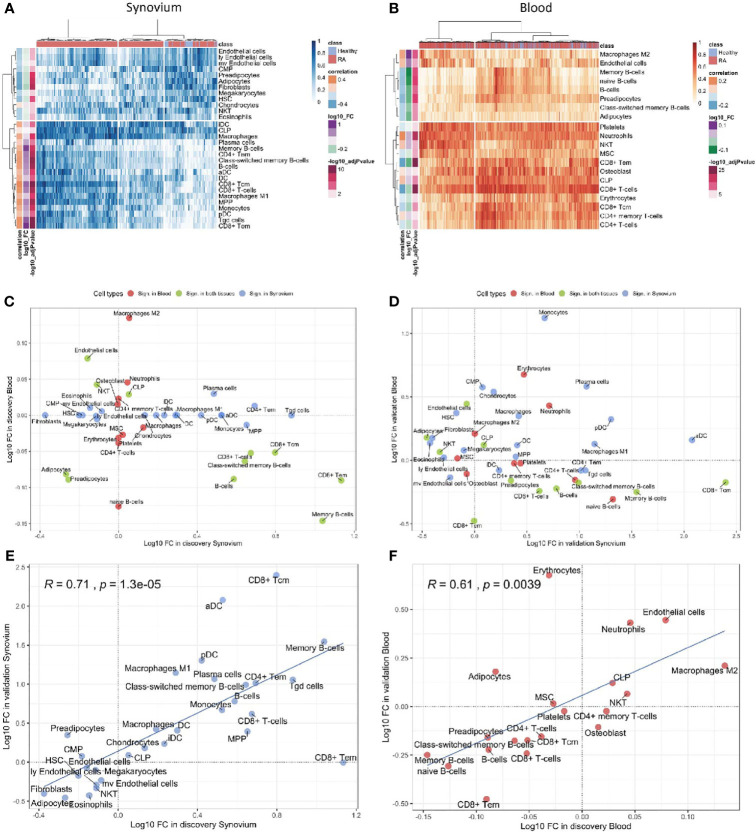
Figure 3.
Cell type enrichment analysis for synovium and whole blood tissues. 30 cell types were significant (BH adj p-values < 0.05) in synovium and 20 were significant in whole blood with 11 common cell types between the tisuues. Heatmap plots of significantly enriched cell types in (A) synovium and (B) blood. The scatter plots comparing log10 transformed fold changes of significant cell types between synovium and blood in (C) discovery and (D) validation cohorts. The scatter plots comparing log10 transformed fold changes of significant cell types between discovery and validation cohorts in (E) synovium and (F) blood tissues, with Pearson correlation coefficient and it's p-value.

