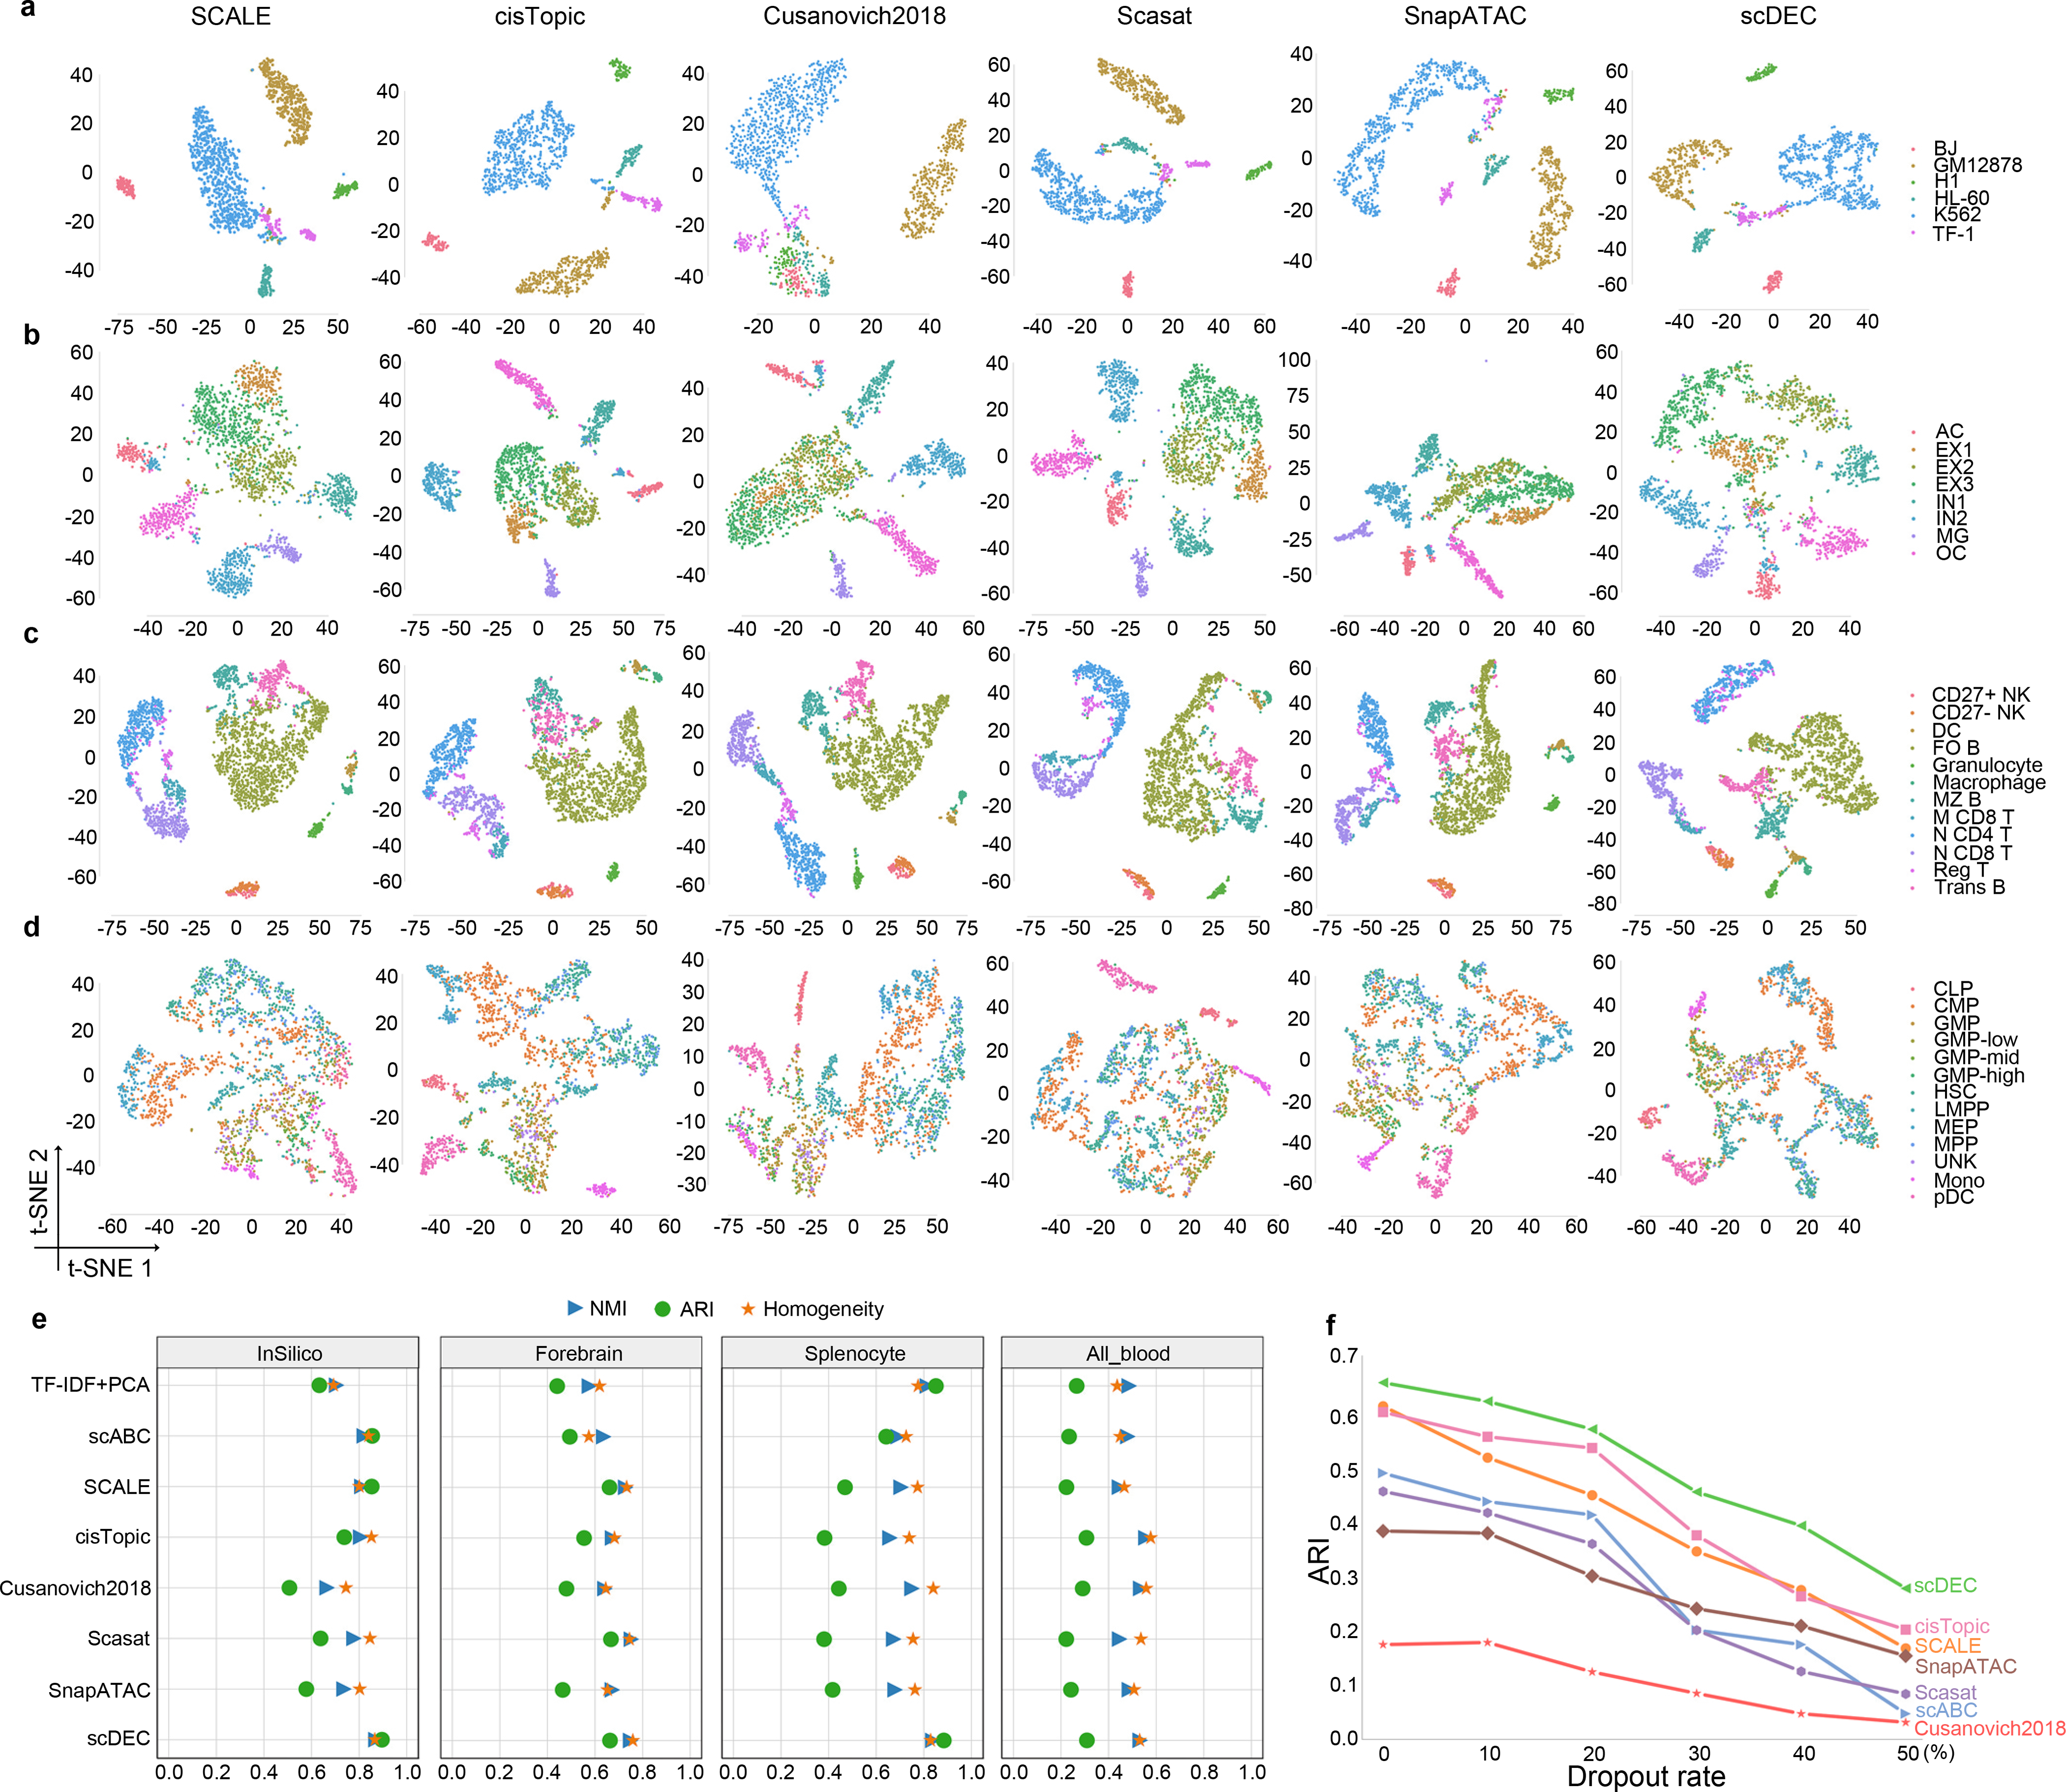
Fig. 2.

Evaluation of scDEC compared with other baseline methods. a. Visualization of InSilico dataset by different methods. b. Visualization of Forebrain dataset by different methods. c. Visualization of Splenocyte dataset by different methods. d. Visualization of All_blood dataset by different methods. e. Clustering results of different methods across four datasets. f. Performance of different methods under different dropout rate on the Forebrain dataset.
