Fig. 3.

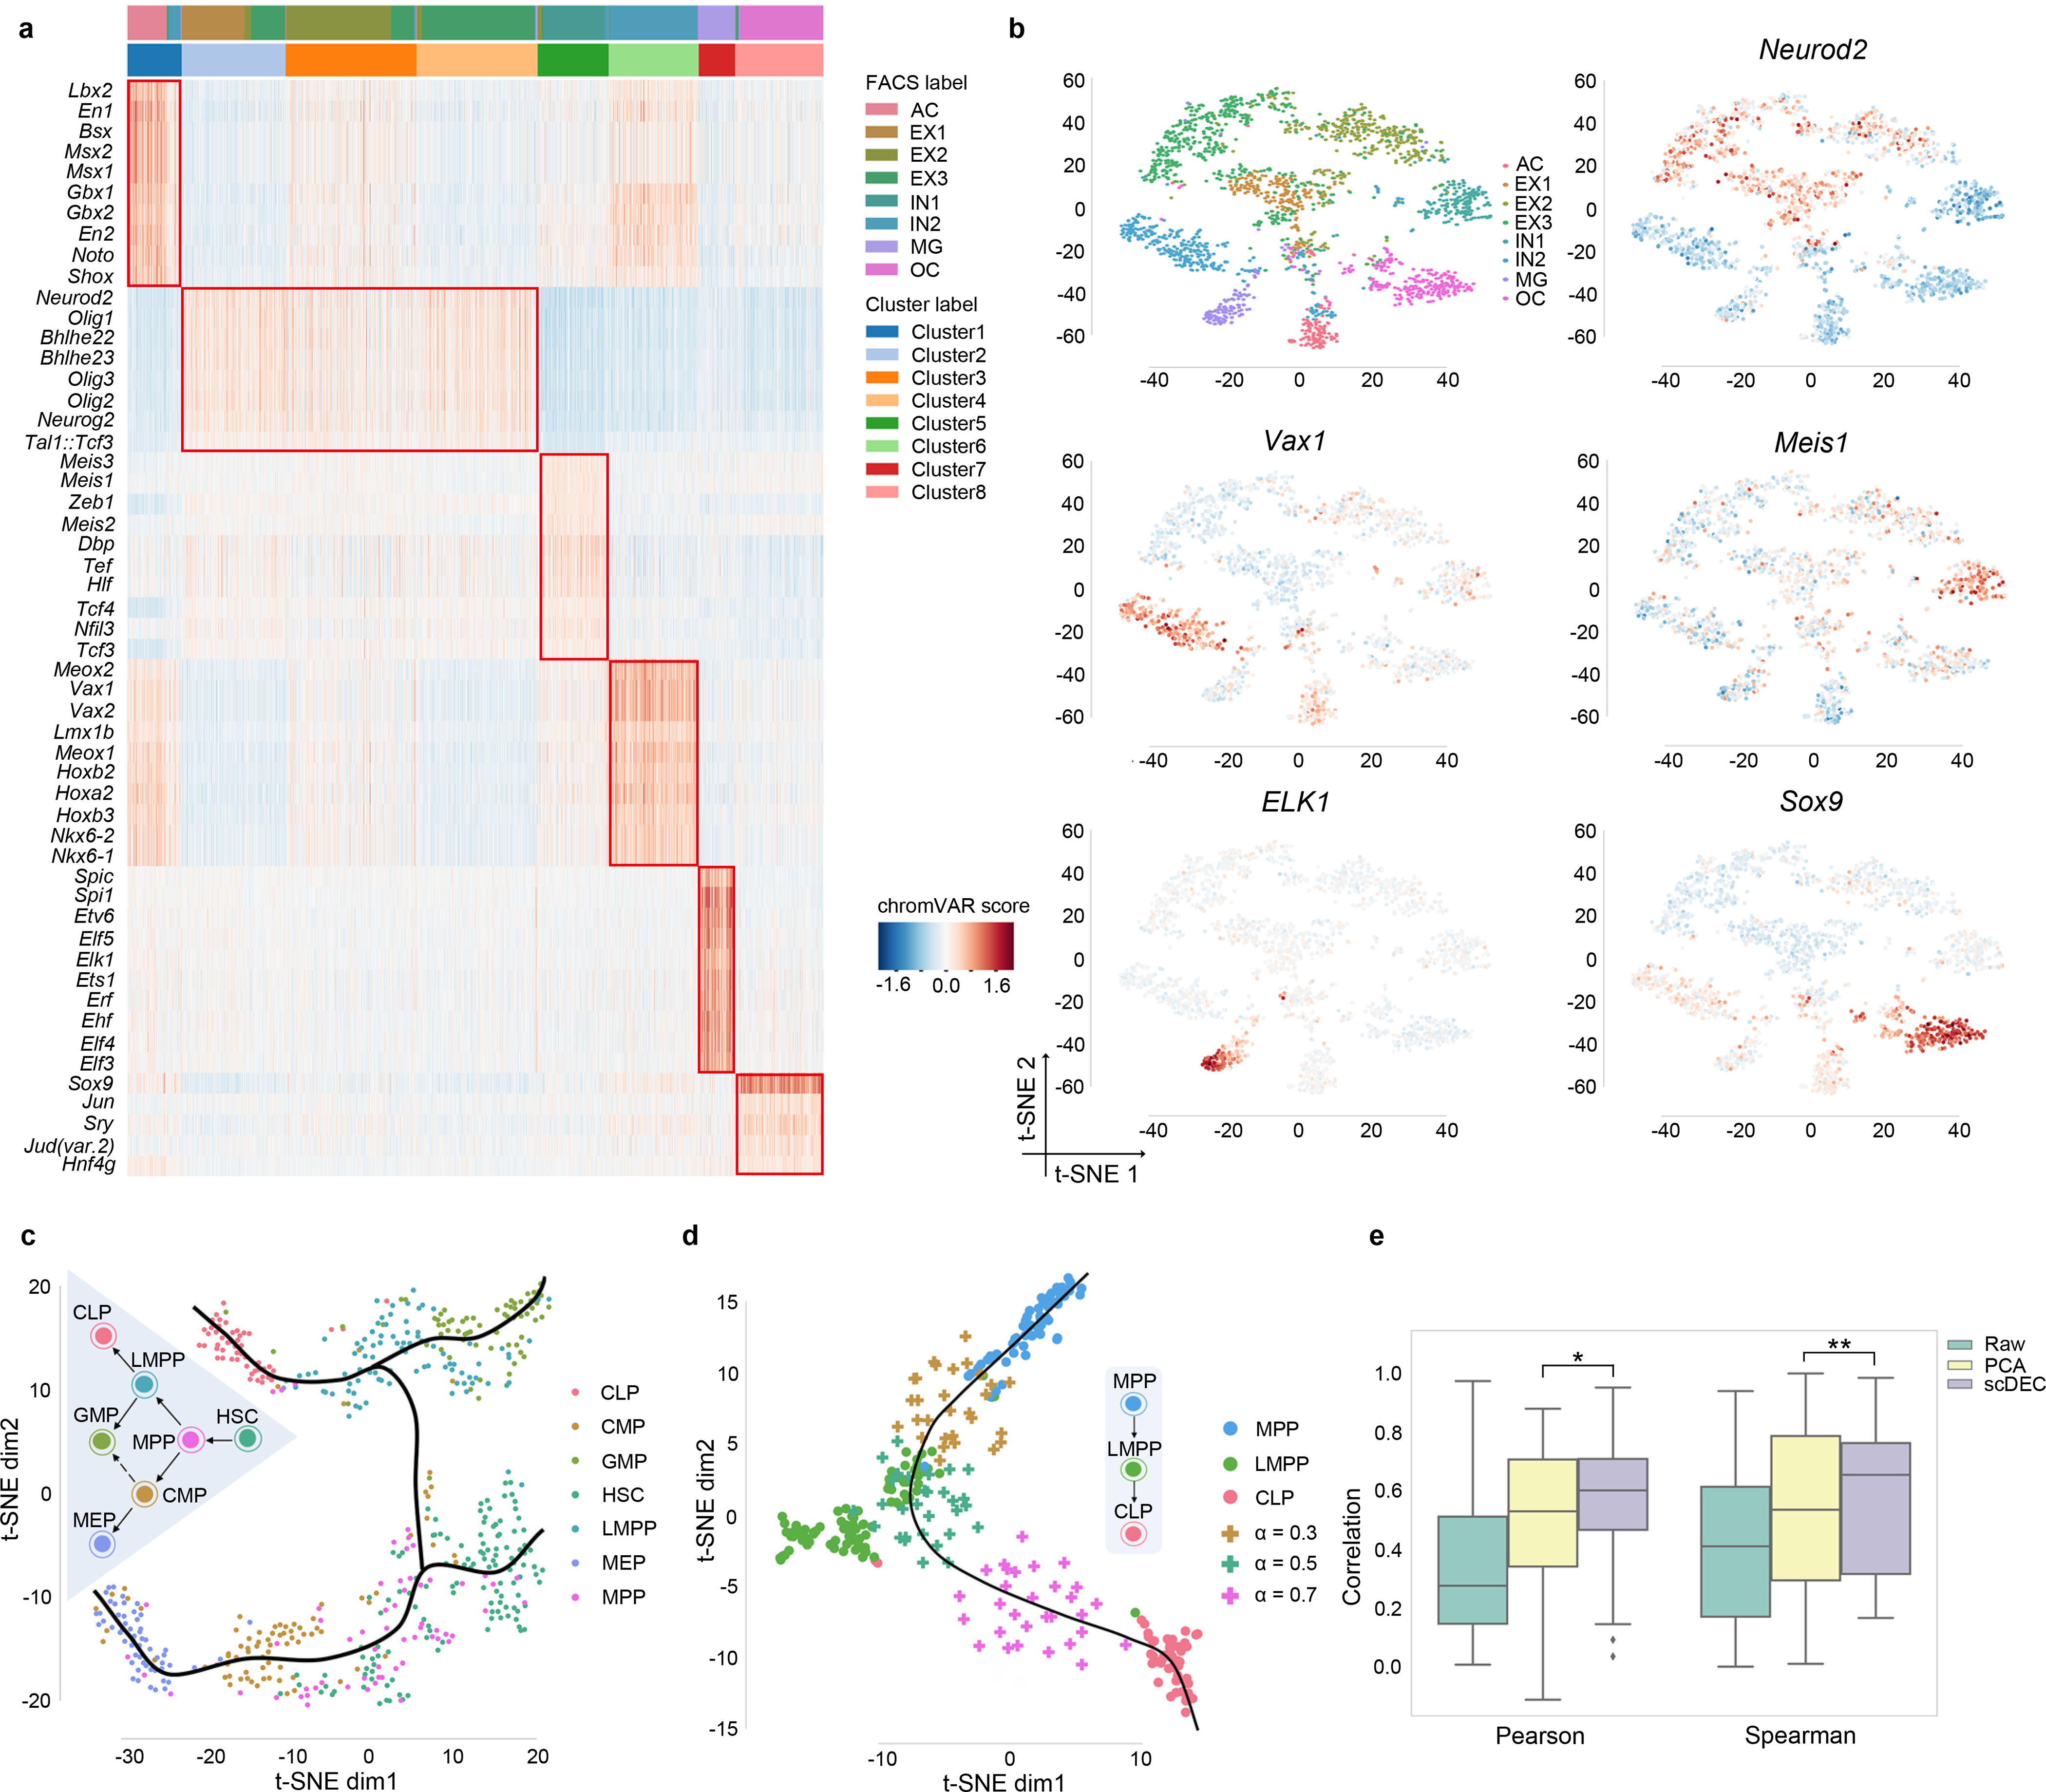
Cluster-specific motif recovery and trajectory inference. a. Heatmap of enriched motifs, each row denotes a motif and each column denotes a cell. Both cluster label and FACS label were provided and aligned. b. The t-SNE visualization of several literature-validated motifs. c. The hematopoiesis differentiation trajectory inferred by scDEC. d. The generated intermediate state between MPP and CLP. 30 data points were generated at different generation coefficient α. e. The generated intermediate scATAC data by interpolation on the latent label indicator has a higher correlation with the meta cell (the average profile of ground truth cells) than the scATAC-seq that were directly interpolated on the raw data and PCA reduced data. * p-value<1.28×10⁻¹⁶, ** p-value< 4.40×10⁻⁸
