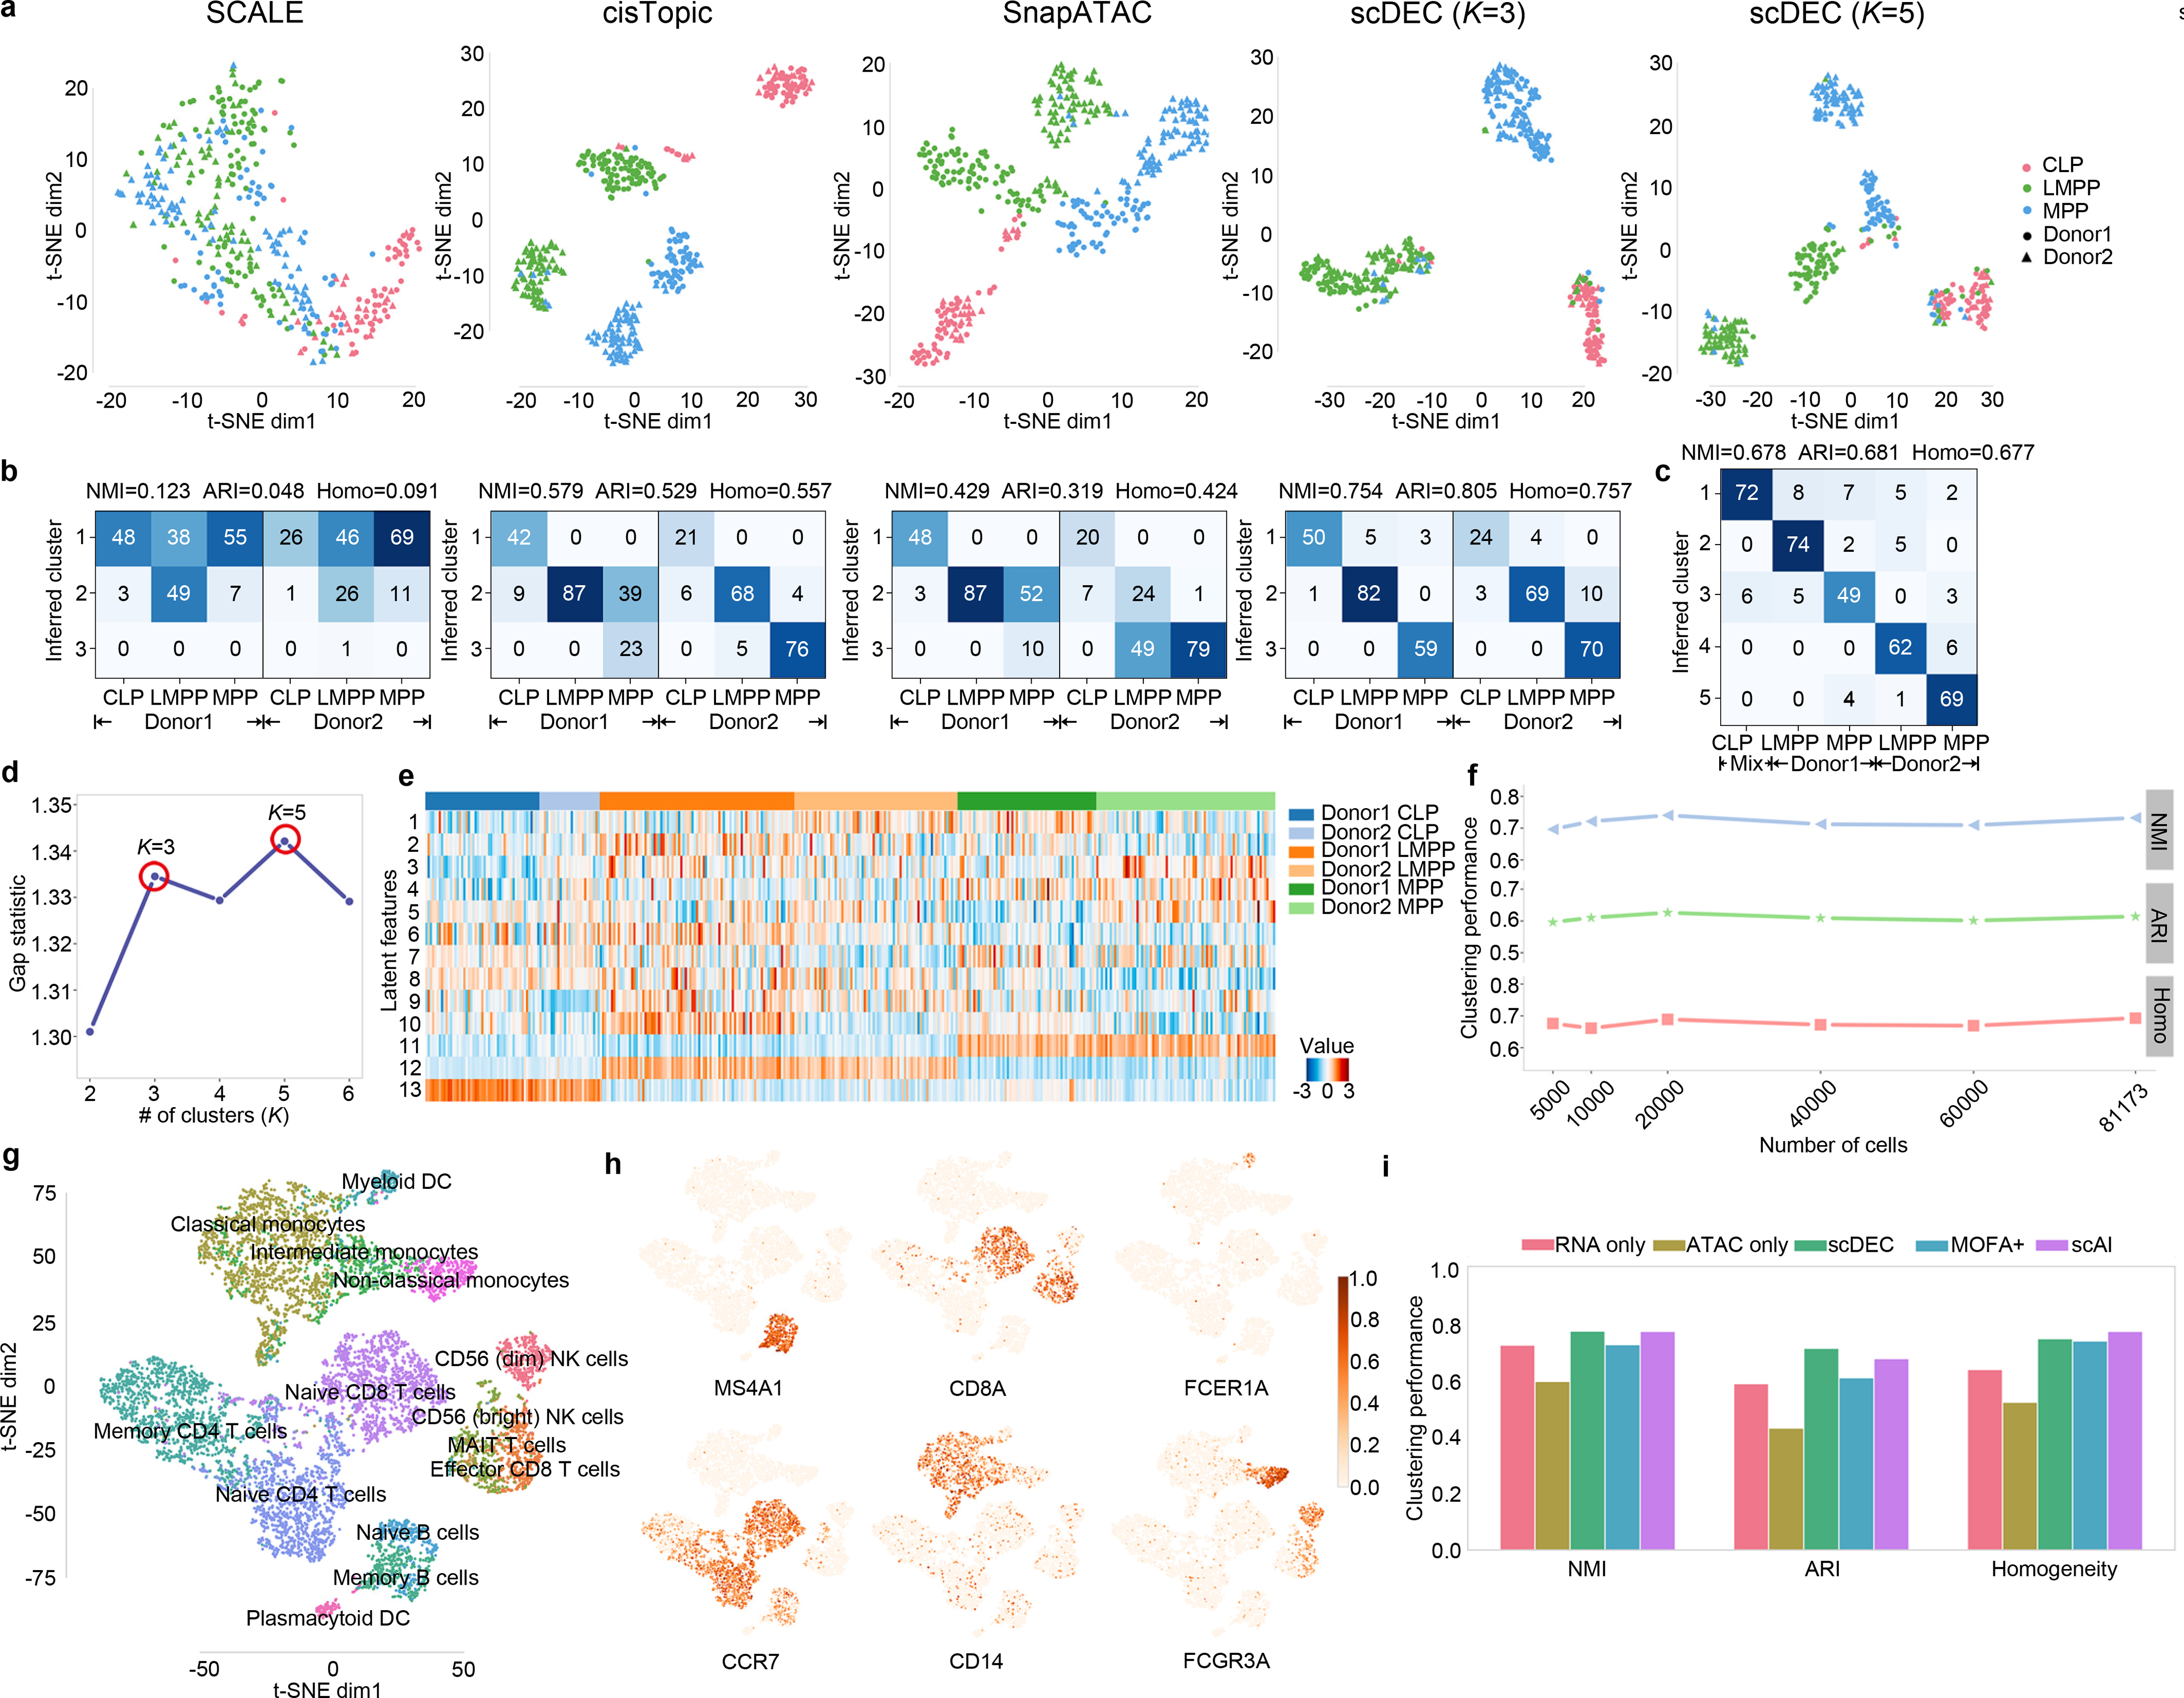
Fig. 4.

scDEC alleviates donor effect and is applicable to large dataset and multi-modal single cell dataset. a. The t-SNE visualization, for CLP, LMPP, MPP cells of the latent features learned by different methods. Different colors denote different cell types and different shape (circle or triangle) represents which donor it comes from. For scDEC, different K (3 and 5) results in different latent features visualization. b. The confusion matrix of the clustering by scDEC and comparing methods (K=3). The NMI, ARI and Homogeneity are also annotated on the top of the confusion matrix. c. The confusion matrix of the clustering by scDEC when K=5. The x-axis denotes the where the cell is coming from while the y-axis denotes the inferred cluster. Mix CLP denotes CLP cells from both donors. d. The gap statistic shows two modes at K=3 and K=5, respectively. e. The visualization of the latent features learned by scDEC. The first 10 dimensions correspond to the continuous latent variable and the last three features correspond to the discrete latent variable . f. The clustering performance of scDEC when applying to a large mouse atlas dataset. g. The t-SNE visualization of around 10k PBMC cells colored by the annotated labels from the 10x Genomic R&D team. h. The same t-SNE plot colored by the normalized expression of the marker genes. i. The clustering performance of scDEC when applied to uni-modal single cell data and multi-modal single cell data (scRNA-seq and scATAC-seq measured in the same cell). The clustering performance of two comparison methods were also demonstrated.
