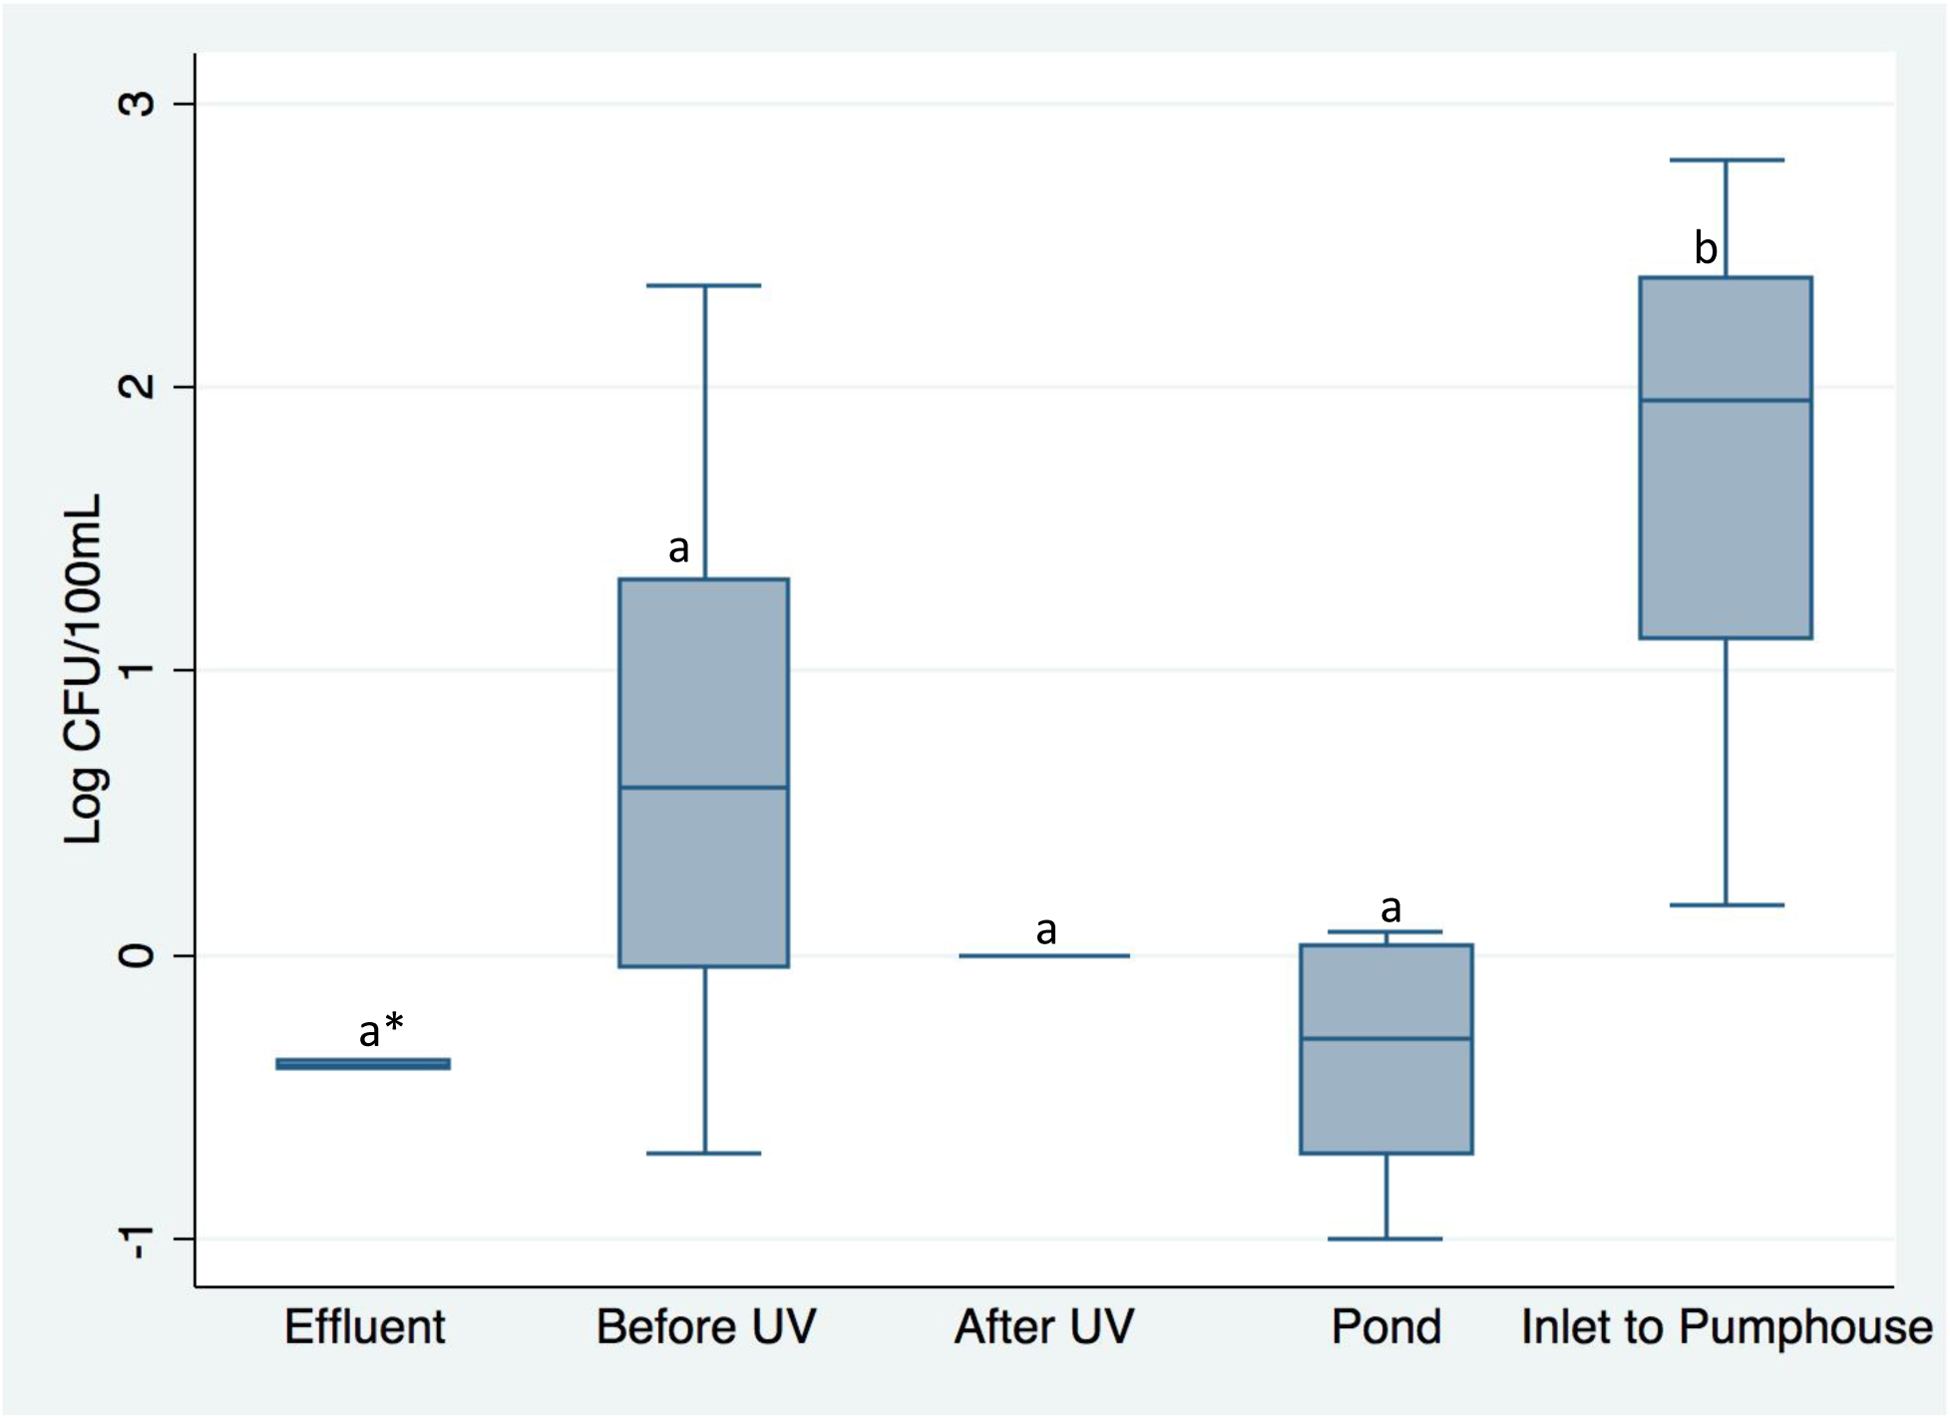
Figure 2.

Average log concentrations of total enterococci (Log CFU/100mL) as reclaimed water flows through treatment and storage locations at Mid-Atlantic Spray Irrigation Site 1. Whiskers are drawn from the 75th percentile to the upper adjacent value and from the 25th percentile to the lower adjacent value, the mid-line is the median, letters indicate statistical significance based on post-hoc analyses (p ≤ 0.05), and * indicates that the difference between the effluent and inlet to pumphouse samples was marginally significant (p ≤ 0.06).
