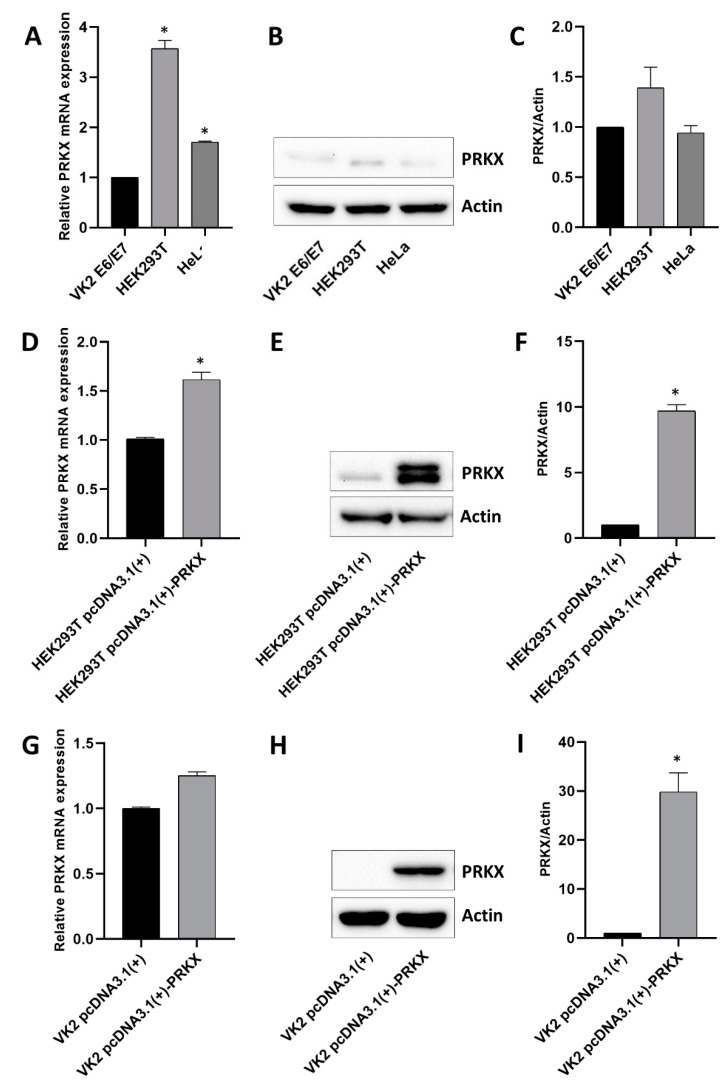
Figure 3.
PRKX basal expression in selected human cell lines and PRKX expression vector assessment. (A) RT-qPCR analysis performed on RNA extracted from VK2 E6/E7, HEK293T and HeLa cell lines showing PRKX mRNA levels relative fold change. (B) Representative Western blot for PRKX in VK2 E6/E7, HEK293T and HeLa cell lines (β-Actin was used as loading control) and densitometric analysis (C) (mean ± SD; n = 2; * p < 0.05; Student’s t-test). (D) RT-qPCR analysis showing PRKX mRNA levels in HEK293T transfected with PRKX expression vectors (pcDNA3.1(+)-PRKX) or empty vectors as controls (pcDNA3.1(+)). (E) Representative Western blot for PRKX in HEK293T transfected with pcDNA3.1(+)-PRKX or pcDNA3.1(+) as control (β-Actin was used as loading control) and densitometric analysis (F) (mean ± SD; n = 2; * p < 0.05; Student’s t-test). (G) RT-qPCR analysis showing PRKX mRNA levels in VK2 E6/E7 transfected with PRKX expression vector (pcDNA3.1(+)-PRKX) or empty vector as control (pcDNA3.1(+)). (H) Representative Western blot for PRKX in VK2 E6/E7 transfected with pcDNA3.1(+)-PRKX or pcDNA3.1(+) as control (β-Actin was used as loading control) and densitometric analysis (I) (mean ± SD; n = 2; * p < 0.05; Student’s t-test). The original Western Blot images can be found in Figure S1.

