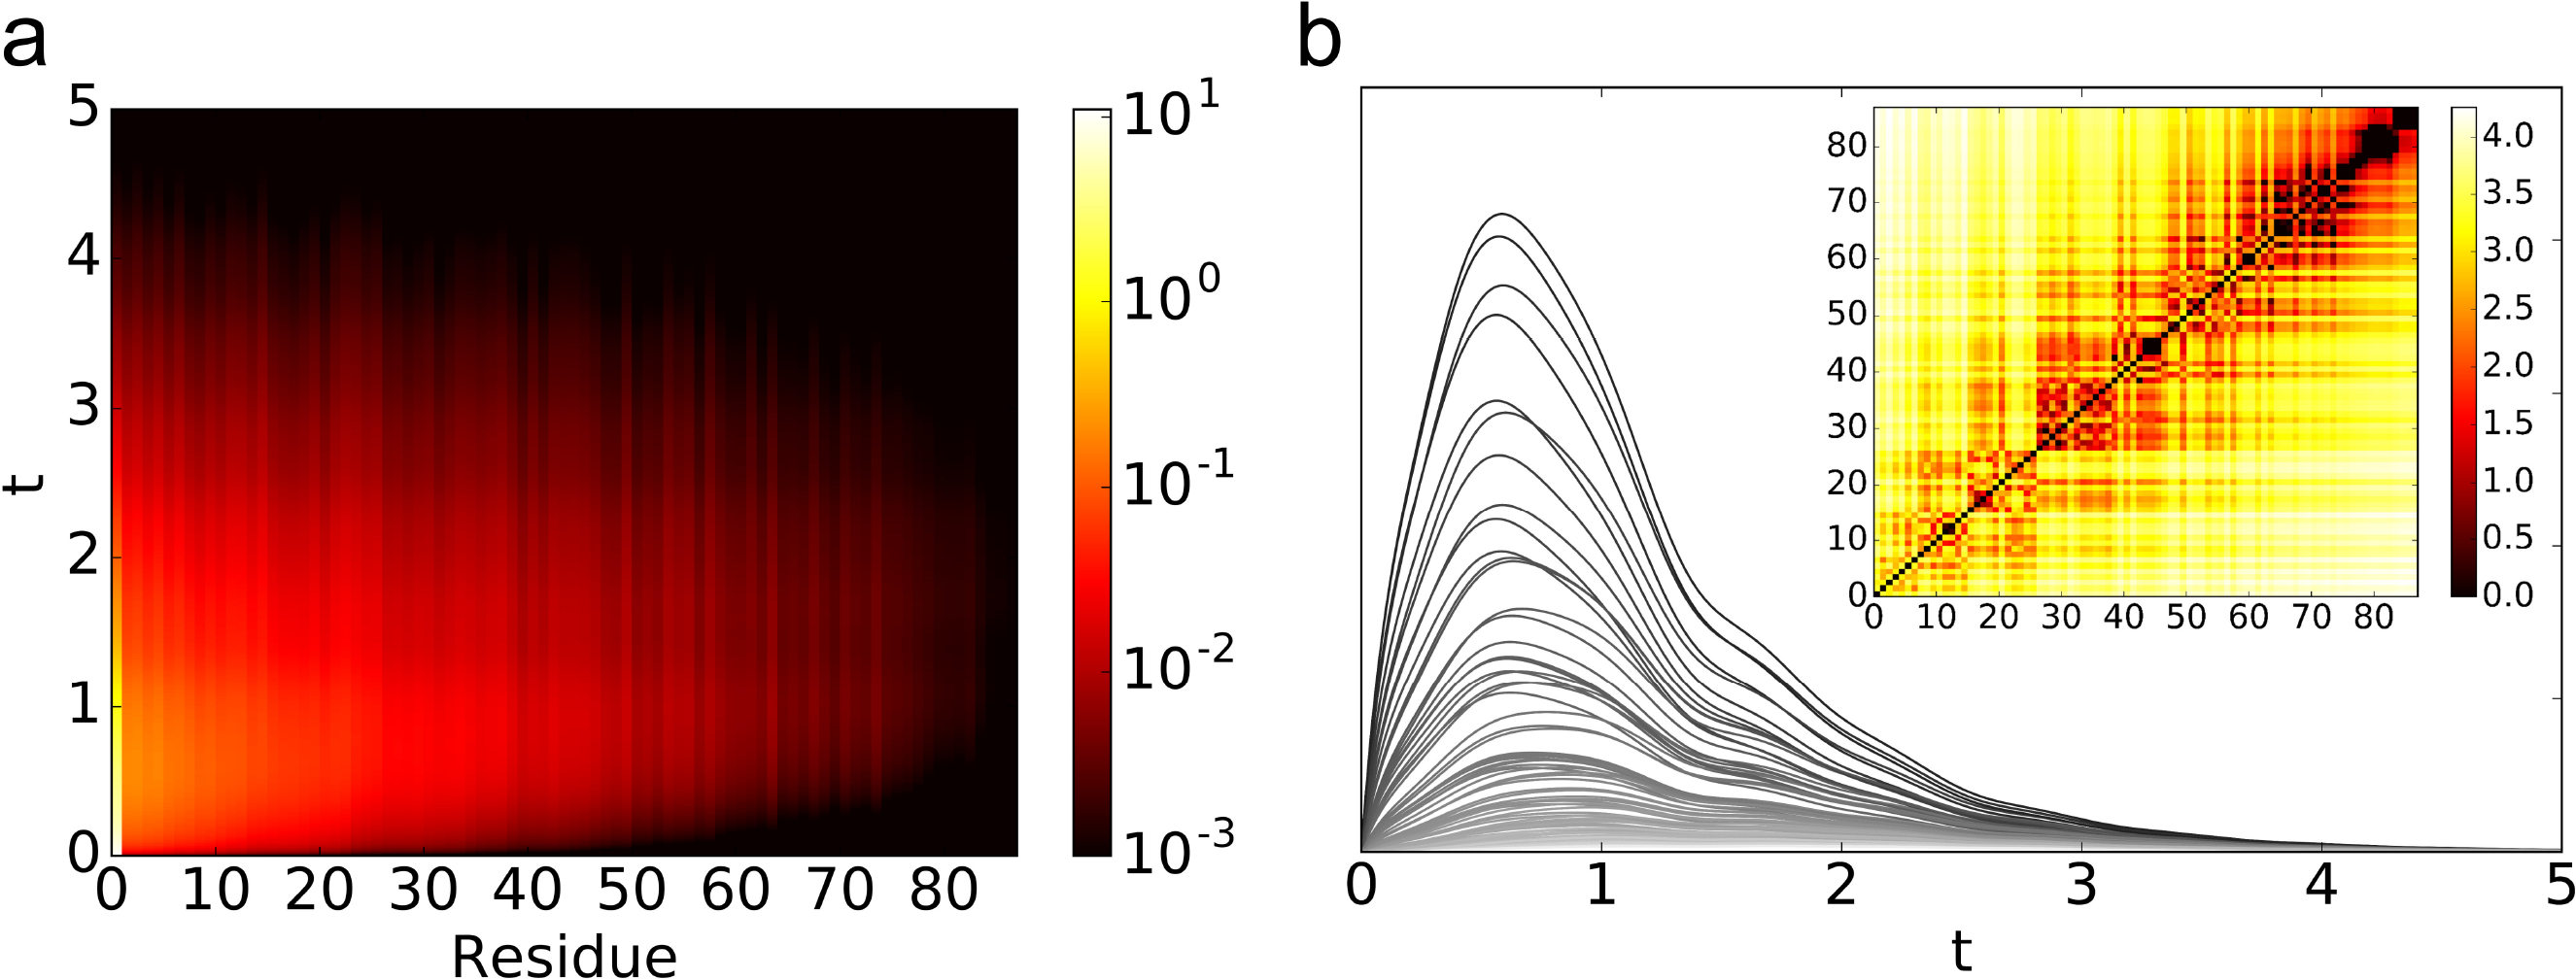
Fig. 5.

The result of perturbing residue 31 in protein (PDB:1ABA). (a) The modified trajectories as defined in Eq. (8) is plotted for each residue after the perturbation at t = 0 as a heatmap. The residues are ordered by the (geometric) distance to the perturbed site from the closest to the farthest. (b) The modified trajectories as defined in Eq. (8) is plotted for each residue after the perturbation at t = 0 as line plots. The darker lines are closer to the perturbed site. The heatmap shows filtration value for the edges as defined in Eq. (10) and the order of residues is the same as in (a). The parameters for the coupled Lorenz system and the perturbation method are the same as that of Fig. 4.
