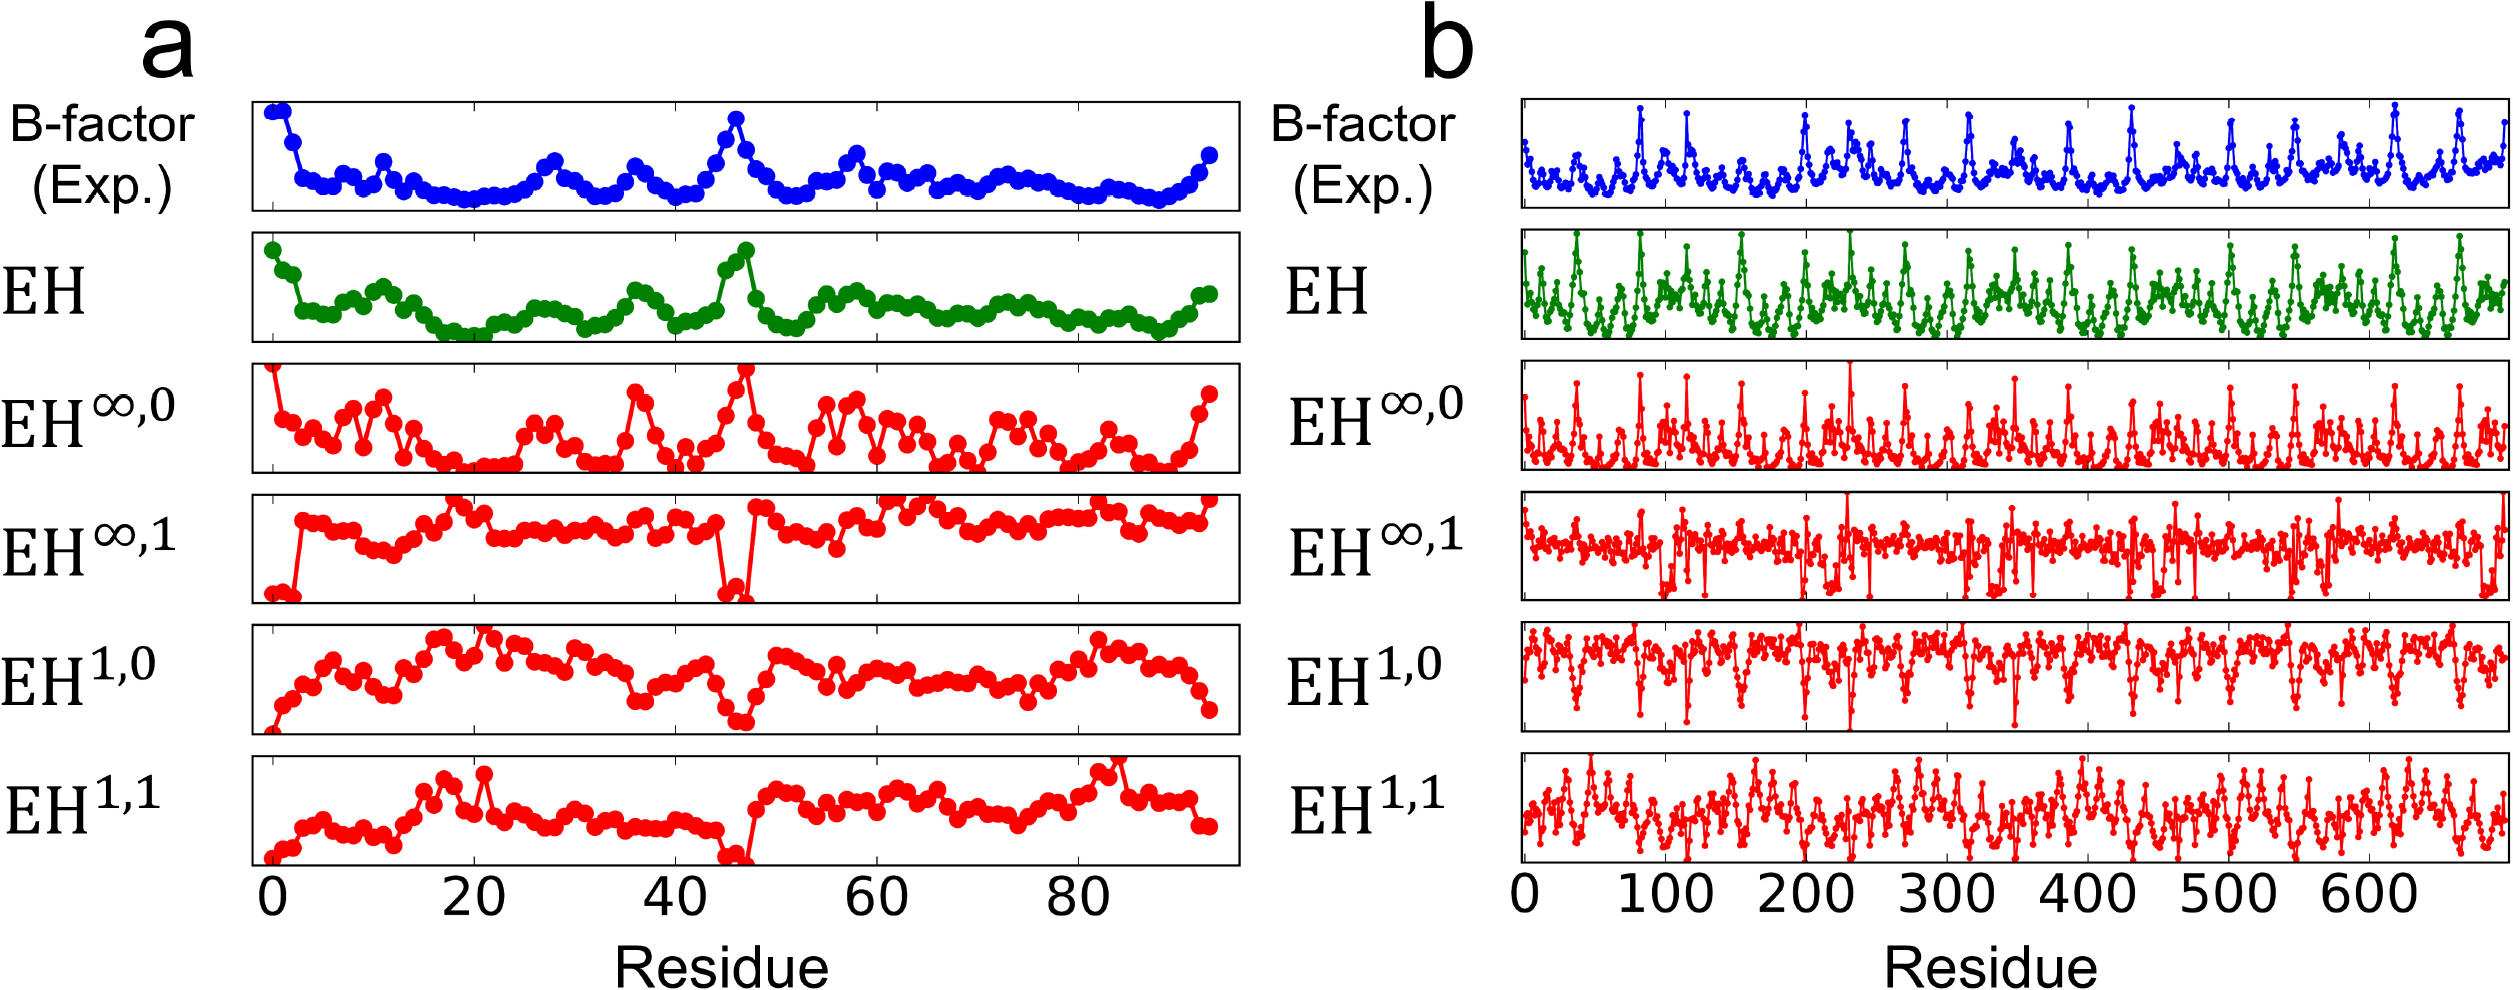
Fig. 9.

B-factors and the computed topological features. EH shows the linear regression with EH1,0, EH1,1, EH∞,1, EH∞,0, EH1,0, EH1,1, EH2,0and EH2,1 within each protein. The y-axes of the panels have different scales to show the correlation between the variances. (a) PDB:3PSM with 94 residues. (b) PDB:3SZH with 697 residues.
