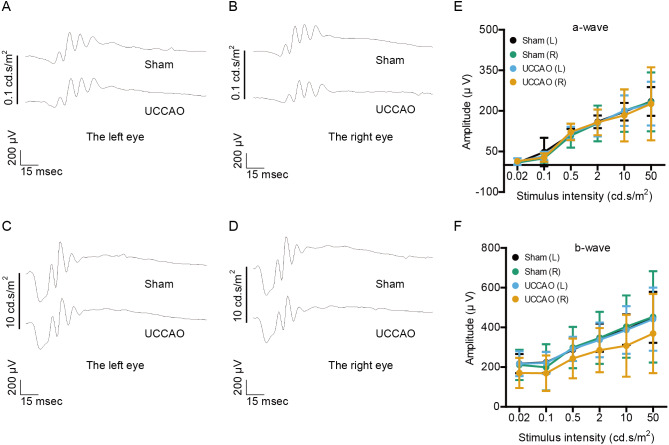
Figure 1. Any change in retinal function is not seen on day 3 after UCCAO.
(A–D) Representative waveforms of a- and b-waves (low and high intensities, 0.1 and 10 cd s/m2, respectively) of the right and left eyes in the sham- and UCCAO-operated mice (n = 8 for UCCAO-operated group and 8 for sham-operated group) and (E–F) quantitative analyses showed that the amplitudes of a- and b-waves were not significantly different among all of the eyes in sham- and UCCAO-operated mice 3 days after the operation. Graphs were presented as mean ± standard deviation. The data were analyzed using a two-tailed Student’s t-test. P > 0.05. Black (sham L), the sham-operated left eye; bluish green (sham R), the sham-operated right eye; sky blue (UCCAO L), the UCCAO-operated left eye; orange (UCCAO R), the UCCAO-operated right eye.

